Solving Equations
How many solutions?
Linear or Not Linear
Relationships(Equations)
Graph Statements
Transformations
Scatterplots
100
X + 8 = 32
x = 24
100
Determine the number of solutions for the equation below.
-6x + 3 = 3x + 2 − 9x
A. No Solutions
B. One Solution
C. Two Solutions
D. Infinite Solutions
A.
100
Linear or Not Linear?
y = 2x + 3
Linear
100
The table shows the relationship between hours spent knitting and the number of scarves Laura knits.
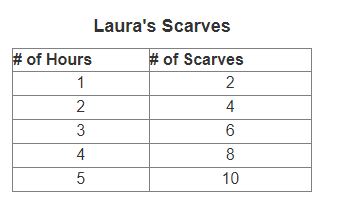
Which equation shows this relationship when x represents the number of hours and y represents the number of scarves?
a. y = x2
b. y = 2x + 1
c. y = 2x
d. y = x + 2
![]()
C.
100
Look at the graph below. Choose all of the true statements.

A.The change in temperature is constant.
B. Wednesday had the highest average temperature of the week.
C. Monday had the lowest average temperature of the week.
D. It was 20 degrees warmer on Tuesday compared to Thursday.
E. The temperature dropped from Wednesday to Thursday.
B and E
100
Quadrilateral ABCD is rotated about the origin as shown below.
Which rotation of quadrilateral ABCD results in the image A'B'C'D' shown on the grid?
A. 90° clockwise
B. 90° counterclockwise
C. 180° counterclockwise
D. 270° clockwise
![]()
C.
100
Based upon the data shown on the scatter plot below, which of the following statements is true?
A. There is a positive association between the sale of sweaters and rising temperatures.
B. There is a negative association between the sale of sweaters and rising temperatures.
C. There is no association between the sale of sweaters and temperatures.
D. More sweaters are sold as the temperatures rise.
B.
200
Find x by solving the following equation:
-3x - 10 = 20
x = -10
200
The graph shows a system of equations. What is the solution of the system?
(-2, -5)
200
Linear or Not Linear?
y = 3x2 - 2
Not Linear
200
The following table shows the relationship between seconds and the number of bacteria in a culture.
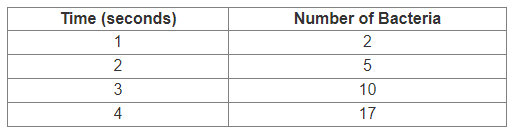
Which equation shows this relationship when t represents the number of seconds and n represents the number of bacteria?
A. n = 2n + 1
B. n = t + 2
C. n = t2 + 1
D. n = t2
C.
200
The graph shows temperatures recorded at a weather station over several hours. According to the graph, what is the rate of change in temperature per hour?
-4
200
In the diagram below,  ABC was reflected across the y-axis resulting in EFG.
How does  ABC compare to EFG?
A. ABC is larger than EFG.
B. ABC is congruent to EFG.
C. ABC is smaller than EFG.
D. There is not enough information to determine a relationship between ABC and EFG.
B
200
The scatter plot below shows the number of bags of popcorn sold at a snack bar on days with different maximum outside temperatures. Look at the data and answer the following questions. Be sure to answer all three parts.
Select all of the true statements about the data provided.
A. There is a positive association between the amount of popcorn sold and the temperature.
B. There is a negative association between the amount of popcorn sold and the temperature.
C. There is no association between the amount of popcorn sold and the temperature.
D. The point that represents 90 orders of popcorn sold when it was 5°F is an outlier.
E. There are no outliers.
B and E
300
Find x by solving he following equation:
2(4x + 6) = 28
x = 2
300
The graph below shows a system of equations. What is the solution of the system?
(-3,1)
300
Linear or Not Linear?
y = x3 + 4
Not Linear
300
Shipping costs for items bought at an online warehouse are based on the number of items ordered. The table shows the shipping costs for orders consisting of 1 to 5 items.
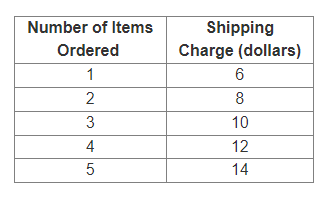
Which rule describes the relationship between the shipping costs, s, in dollars, and the total number of items ordered, n?
A. s = 4n + 2
B. s = 3n + 3
C. s = 2n + 4
D. s = 3n + 2
C.
300
The graph shows the altitude of an airplane after takeoff. According to the graph, what is the rate of change in feet per second?
25
300
Triangle ABC is rotated about the origin.
Which rotation of triangle ABC results in the image A'B'C' shown on the grid?
A. 90° clockwise
B. 180° clockwise
C. 90° counterclockwise
D. 270° counterclockwise
![]()
C
300
The scatter plot below shows the relationship between the number of units a toy factory produces and the number of minutes that have passed.
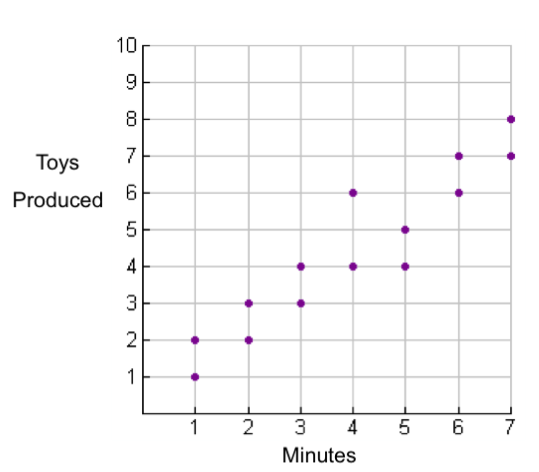
Which equation below would be the most accurate line of best fit for the data in the scatterplot?
A. y = x
B.
C.
D.
A
400
Solve for x:
1/3(3x -9) = 12
x = 15
400
The graph below shows a system of equations.
What is the solution of the system?
(-6,-2)
400
Linear or Not Linear?
y = 2x
Linear
400
The following table shows the relationship between time and the total amount of snowfall during a snow storm from noon to 4 p.m.

If the snow continues to fall at the same rate, which equation shows this relationship when h represents time and s represents the total amount of snowfall?
A. s = h2
B. s = 3h - 2
C. s = 2h - 1
D.
s = 3h/2
C
400
The graph shows the money earned by Alice for each hour that she works. According to the graph, what is the rate of change in dollars per hour?
20
400
The graph below shows that  A'B'C' is a transformation of ABC with the origin as the center of the transformation.
What is the transformation used to create the similar triangle A'B'C'?
A. A dilation with a scale factor of 4 and a translation 3 units to the right.
B. A dilation with a scale factor of 2.5.
C. A translation 3 units to the right and 3 units up.
D. A dilation with a scale factor of 2.5 and a translation 3 units to the right and 3 units up.
B
400
The scatter plot below shows the relationship between the number of gallons of gas used and the number of miles traveled on a road trip.

Which statement below best describes the correlation between gallons of gas used and miles traveled on the road trip?
A. There is a negative correlation between gallons of gas used and miles traveled.
B. There is a positive correlation between gallons of gas used and miles traveled.
C. There is no correlation between gallons of gas used and miles traveled.
D. There is not enough information to determine a correlation between gallons of gas used and miles traveled.
B.
500
Solve for x:
-5(-2x - 10) + 5 = 45
x = -1
500
The graph below shows a system of equations. What is the solution of the system?
(-1,-1)
500
Linear or Not Linear?
y = 1/x
Not Linear
500
Write something nice about Mr. Gandy
500
The graph shows Frank's altitude after each hour that he hikes. According to the graph, what is the rate of change in feet per hour?
50
500
Describe the sequence of transformation(s) that maps triangle ABC to the similar triangle A'B'C' as shown below.
A. A dilation with a scale factor of 2 followed by a translation 3 units down.
B. A dilation with a scale factor of 3.
C. A translation 3 units left and 3 units down.
D. A dilation with a scale factor of 3 followed by a translation of 3 units left and 3 units down.
B
500
The scatterplot below shows the relationship between accountants' years of experience and their monthly salaries?

Which equation below accurately represents the line of best fit for the data in the scatterplot?
![]()
![]()
A. 
B. 
C. 
D. 
A.