Graphs
Data From Graphs
Central Tendencies
Solve/Integers
Word Problems
100
 What kind of graph is this?
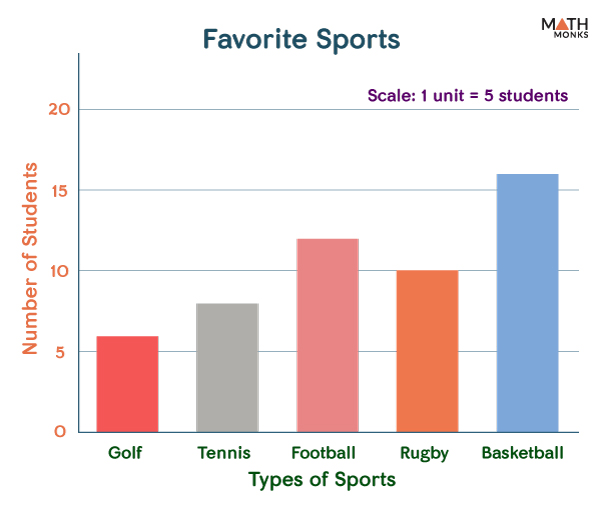
Bar graph
100
What is the favorite sport?
Basketball
100
Find the range:
15, 7, 11, 28, 20, 11, 20
21
100
-7 + 5=
-2
100
Zack has 5 more crayons then Matthew, Matthew has 3 more crayons then Vito. If Vito has 50 crayons how many crayons does Zack have?
Zack has 58 crayons.
200
What kind of graph is thi s?
s?
Circle or pie graph
200
The most least amount of money was spent on...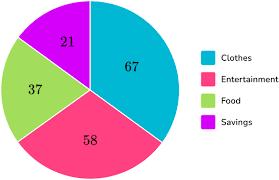
savings
200
Find the mode:
15, 7, 11, 28, 20, 11, 20, 7
7, 11, and 20
200
Evaluate
25 - (-10)
35
200
A kid has 5 lolly pops. He gets 3 more how many lolly pops does the kid have?
The kid has 8 lolly pops.
300
What kind of graph is this?
Pictograph
300
Which pizza is more popular Farmhouse of BBQ?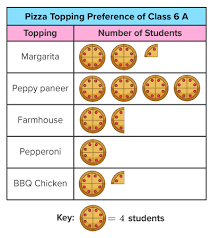 20 divided 5 equals
Farmhouse
300
Find the median:
15, 7, 11, 28, 20, 11, 20
15
300
4x = -24
-6
300
Alvin has 8 candies he gives 6 candies to his friends, how many candies does Alvin have left?
Alvin has 2 candies left.
400
What type of graph is this?
Line plot
400
What is the difference between the number of cars sold on Thursday versus Friday? x=1
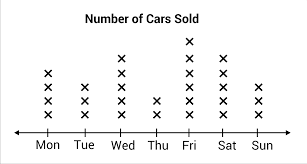
4 cars
400
Find the average:
15, 7, 11, 28, 20, 11
15.3
400
x - 17 = 13
30
400
If you have 87 treats and give 8 treats to your friends how many treats do you have left?
You will have 79 treats left.
500
What type of graph is th is?
is?
Line
500
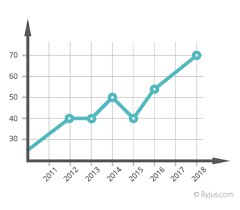 What years had the same data point?
2012, 2013 and 2015
500
Find the average of the data if you add another 20!
16
500
x + 19 <= 32
x = <13
500
Olivia has 5 times more candy then her friend, her friend has 6 candies how much candy does Olivia have?
Olivia has 30 candies.