Relations
Functions
Domain and Range
Graphs
Linear Relations
Potpourri
200
A collection of distinct objects
SET
200
The rule that states a relation is a function if any vertical line passes through its graph no more than once.
Vertical Line Test
200
The set of all possible input values of a relation or function.
Domain
200
On a distance-time graph, a horizontal line segment indicates this.
No movement
200
The graph of this type of function is a straight line.
Linear function
200
The number 5 is one of these in the set {1, 3, 5, 7}.
Element
400
Shows an association between sets, written as (input, output)
ORDERED PAIR
400
This is the reason why the set of ordered pairs {(1, 5), (2, 3), (1, 7)} does NOT represent a function.
The element "1" in the first set is associated with two elements, "5" and "7", in the second set.
400
The set of all possible output values of a relation or function.
Range
400
This is the term for a function whose graph is made of unconnected points, like the number of birds seen per hour.
Discrete function
400
For a linear relation, a constant change in the independent variable results in this.
Constant change in the dependent variable.
400
Five possible methods of representing a relation.
Ordered Pairs
Arrow Diagram
Table
Bar graph
Diagram
600
Shows an association between sets using arrows connecting elements from the first set to elements in the second set.
ARROW DIAGRAM
600
In the function f(x) = 2x + 1, the input 'x' is known as this type of variable.
Independent variable
600
For the set of ordered pairs {(-1, 0), (0, 2), (2, 2), (3, 5)}, this is the range.
{0, 2, 5}
600
On a graph, this is the point where the line crosses the y-axis
Y-intercept
600
The cost for a car rental is $60, plus $20 for every 100km driven. The cost for 800km is this.
$220
600
The notation f(x) is known by this name.
Function notation
800
Describe this relation in words.
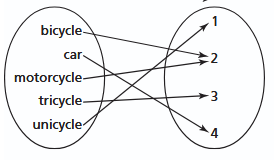
A relation between a set of vehicles and a set of natural numbers that is the number of wheels those vehicles have.
800
If a worker's pay depends on the number of hours worked, the pay is this type of variable.
Dependent Variable
800
Domain of the function shown here:

800
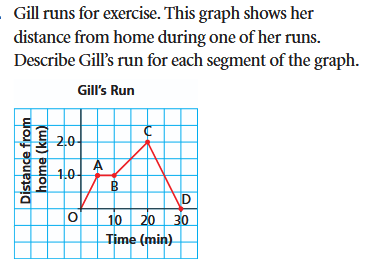
OA: Runs at constant velocity for 5 minutes
AB: 5 minute rest (stopped)
BC: Runs at constant velocity for 10 minutes (slower than OA).
CD: Runs back home in 10 minutes.
800
This is the rate of change (slope) of the line that passes through the points (1, 1) and (3, 7).
3
800
If you state a function is discrete, you should NOT do this when graphing its points.
Connect the dots
1000
Represent the relation "name related to age" as a set of ordered pairs.
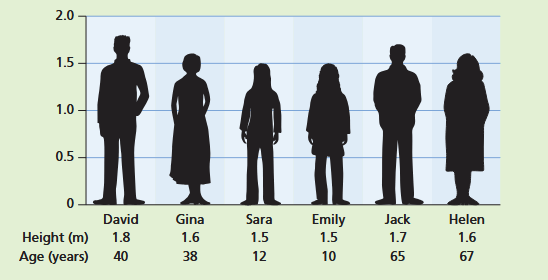
(David, 40), (Gina,38), (Sara, 12), (Emily,10), (Jack,65), (Helen, 67)
1000
Evaluate f(3) for the function f(x) = x² - 4.
5
1000
Range of the function shown here
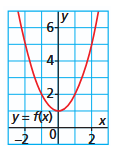
y>=1
1000
Determine the x intercept, y intercept, and rate of change for this graph.
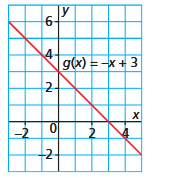
X-intercept (3,0)
y-intercept (0,3)
Rate of change -1
1000
Determine the rate of change and g(6) for this function. 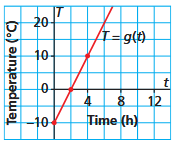
Rate of change: 5°C/h
g(6)=20°C1000
Meaning of an open circle on the end of a graph of a relation or function.
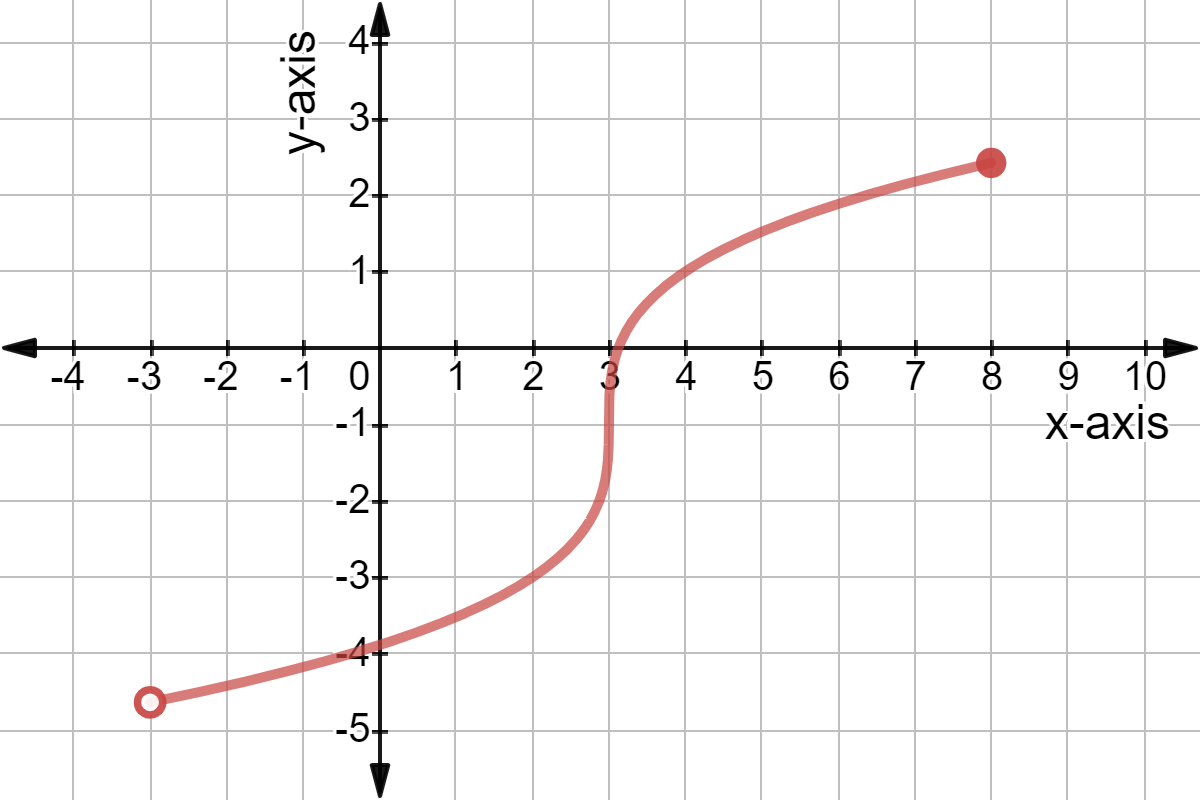
That point is NOT part of the domain or range.