Fraction Models
Real-World Quests
Line Graph Reasoning
Multi-Step Fraction Problems
Data & Categorizing
100
A baker makes 7 batches of muffins.
Each batch uses 3/4 cup of sugar.
Draw a model to represent the total sugar used.
How many cups are used altogether?
7 × 3/4 = 21/4 = 5 1/4 cups
100
2,862 beads.
18 beads per bracelet.
How many complete bracelets can be made?
2,862 ÷ 18 = 159 bracelets
100
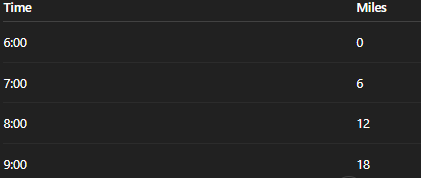 A runner’s distances are shown.
How many miles were run between 7:00 and 9:00?
18 − 6 = 12 miles
100
Six friends share 1/2 of a cake equally.
How much does each get?
1/2 ÷ 6 = 1/12
100
1. Is this categorical or numerical data? “What is your favorite sport?”
2.Is this categorical or numerical? “How many siblings do you have?”
1. Categorical 2. Numerical
200
Three whole rectangles are divided into eighths.
Rectangle 1: 8/8 shaded
Rectangle 2: 8/8 shaded
Rectangle 3: 5/8 shaded
What mixed number does the model represent?
2 5/8
200
3,675 marbles.
47 marbles per bag.
How many bags are needed?
3,675 ÷ 47 = 78 bags (exact)
200
How much did the water cool over 10 minutes?

212 − 155 = 57°F
200
A recipe needs:
2 1/2 cups flour
3/8 cup sugar
1/4 cup chocolate chips
How many cups total?
3 1/8 cups
200
1. Which graph is best for tracking temperature over time?
2. Why would a line graph NOT be appropriate for favorite foods?
1. Line Graph
2. Because favorite foods are categories, not data that changes over time.
300
A recipe uses 2 1/3 cups of flour.
You make the recipe 3 times.
How much flour is used total?
2 1/3 = 7/3
7/3 × 3 = 21/3 = 7 cups
300
640 students going on a trip.
Each bus seats 35 students.
What is the fewest number of buses needed?
640 ÷ 35 = 18 remainder 10
Need one more bus → 19 buses
300
Between which two hours did the temperature increase the most?
Students should observe:
9:00 → 10:00 = +3°
10:00 → 11:00 = +8°
11:00 → 12:00 = +2°

10:00–11:00 (increase of 8°)
300
A ladder is 12 1/2 feet tall.
Another ladder is 9 3/4 feet tall.
How much taller is the first ladder?
2 3/4 feet
300
1. Explain why division with remainders must sometimes round up in real-world problems.
2. A survey shows the following results:
Soccer – 12 students
Basketball – 7 students
Baseball – 5 students
Track – 6 students
How many students were surveyed?
How many more students chose soccer than baseball?
Is this data categorical or numerical? Explain.
1. Because you cannot have part of a bus, bag, or bracelet — you need a whole unit to fit everything.
2. 30 students, 7 more students,
Categorical, because students are choosing types of sports (categories), not measuring or counting amounts.
400
A container holds 4 liters of juice. Each serving is 2/5 liter. How many servings can be made?
4 ÷ 2/5 = 4 × 5/2 = 20/2 = 10 servings
400
A factory makes 8,028 items in 12 hours.
How many items are made per hour?
8,028 ÷ 12 = 669
400
When did the biker stop riding?
Students should notice the distance stays at 10 miles from 11:00 to 12:00. 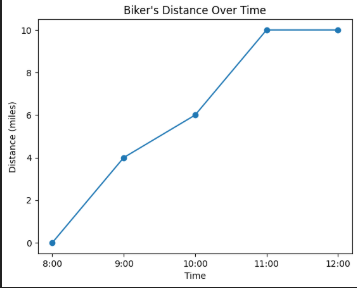
Between 11:00 and 12:00
400
Each vegetable patty weighs 1/4 pound.
10 patties are made.
What is the total weight?
2 1/2 pounds
400
A teacher asks these survey questions:
How many books did you read this month?
What genre of book do you prefer?
How many minutes do you read each night?
What is your favorite reading spot?
Which TWO questions will result in categorical data?
Questions 2 and 4
500
A baker has 9 1/2 cups of flour.
She uses 3/4 of it.
How many cups does she use?
9 1/2 = 19/2
19/2 × 3/4 = 57/8 = 7 1/8 cups
500
A company packages 9,450 pencils into packs of 15.
How many packs are made?
9,450 ÷ 15 = 630
500
Maria drove:
7:00 – 50 miles
8:00 – 110 miles
9:00 – 170 miles
What was her average rate per hour between 7:00 and 9:00?
 What was her average rate per hour between 7:00 and 9:00?
60 miles per hour
500
A 65-mile trip is 2/3 completed.
How many miles have been driven?
43 1/3 miles
500
A class collects data about students’ favorite school subjects:
Math – 9 students
Science – 6 students
Reading – 8 students
Social Studies – 5 students
What type of graph would best display this data?
A bar graph