Transformations
Statistics
Mean Absolute
Deviation
Deviation
Simple Probability and its Compliment
Slope
100
True or false:
There are four transformations. After a shape is transformed it is called the pre-image.
False
100
True or false:
The median of a data set can be fount by adding the numbers together and dividing by the amount of numbers
False
100
Find the MAD of the data set.
95, 90, 70, 100, 65, 85, 80, 95, 100, 50
Mean Absolute Deviation: 13.4
100
True or False:
The probability of getting wet if you jump in a pool is likely
False
certain
100
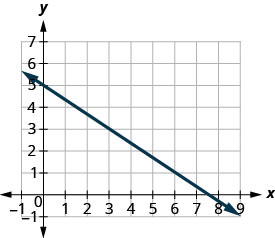
What is the slope of the line?

-3/4
200
Identify the transformation used:
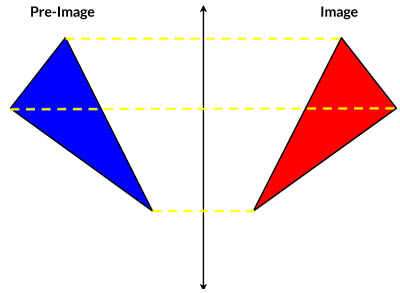
Reflection
200
Find the mode of the data set:
1,3,9,9,0,1,5,7,9,8
9
200
TRUE or FALSE:
the median of the data set is 21.1
18, 24, 24,18, 18, 20, 21, 23, 22, 23
FALSE
21.5
200
Find the complement of each probability
1/6
24/30
16/18
5/6
6/30
2/18
200
Identify the slope
-3/2
300
There is a geometric figure with the points (-6,0), (-10,0), and (-6,3). What would the coordinates of the figure be if rotated 90 degrees clockwise around the origin?
(0,6), (0,10), (3,6)
300
Identify the population in each scenario:
1. 10 students out of the class have all A's
2. A recent survey shows that 14 out of every 20 dog owners have been bitten by their dog
3. A study shows that 68% of employees at Eastern Skateboard Supply don't have children
1. students
2. dog owners
3. Eastern Skateboard Supply employees
300
What are the three steps to finding MAD?
1. find the mean
2. find the positive distance each data point is from the mean
3. find the mean of those distances
300

A female is 9/10 as likely to own a dog as a male is to own a ____
cat
300
Identify the slope of the line
-2/3
400
There is a geometric figure with the points (1,5), (5,1) and (1,1). What would the new points be if the figure was reflected over the y axis?
(-1,5), (-1,1), (-5,1)
400
Mr. Norman conducted a survey for the seventh grade at Hardin Park. There are 96 kids in the whole grade. He asked 10 random students in the hallway whether or not they would prefer lockers in the 7th grade or not. 6 said yes. About how many students out of the whole seventh grade would prefer lockers?
about 58
400
Charlie is finding the Mean Absolute Deviation of a data set. She notices that the MAD is very close to 0. What does this say about the data?
The data is very consistent and close together.
400
Claire is randomly choosing a cone for her ice cream. There are 7 waffle cones, 6 sugar cones, 16 cake cones, 4 chocolate cones, and 3 sprinkle cones. Write two statements comparing the probabilities of the cones to each other.
Example:
a sugar cone is 6/7 as likely to be chosen as a waffle cone.
400
Find the slope of a straight line that passes through the points (1,3)(1,3) and (−1,−1)(−1,−1).
infinite solutions, 3/0
500
There is a rectangle with the points (-5,5), (-2,5), (-5,-5), (-2,-5). Dilate the figure to the scale factor of 1.5
(-7.5,7.5) (-3,7.5) (-7.5,-7.5) (-3,-7.5)
500
Identify if each scenario is a dependent event or an independent one.
1. Two coins are flipped at the same time.
2. You draw an ace and a king from a deck of cards.
3. Savannah randomly chooses two cookies from a basket without replacing them.
1. independent
2. dependent
3. dependent
500
Jenny is taking a survey on 100 students' favorite lunch foods. The data set below shows the number of students who signed up for each lunch choice over the year. Find the MAD of the data.
12, 14, 12, 16, 22, 11, 10, 3
3.625
500
Determine if each event is likely, equally likely, certain, unlikely, or impossible.
1. A coin being flipped and landing on tails
2. Selecting a cookie from a cookie basket
3. Scoring six points on a touchdown
4. Water freezing at 75 degrees
1. equally likely
2. certain
3. certain
4. impossible
500
Find the equation of the straight line that passes through (−2,3)(−2,3) and (1,−2)(1,−2).
ex y=mx+b
y=-5/3x-1/3