Venn Diagrams
Picto-charts
Bar Graphs
Carroll Diagrams
Data
100
How many circles overlap in a Venn Diagram?
2 circles overlap in a Venn Diagram. Sometimes there can be 3 as well.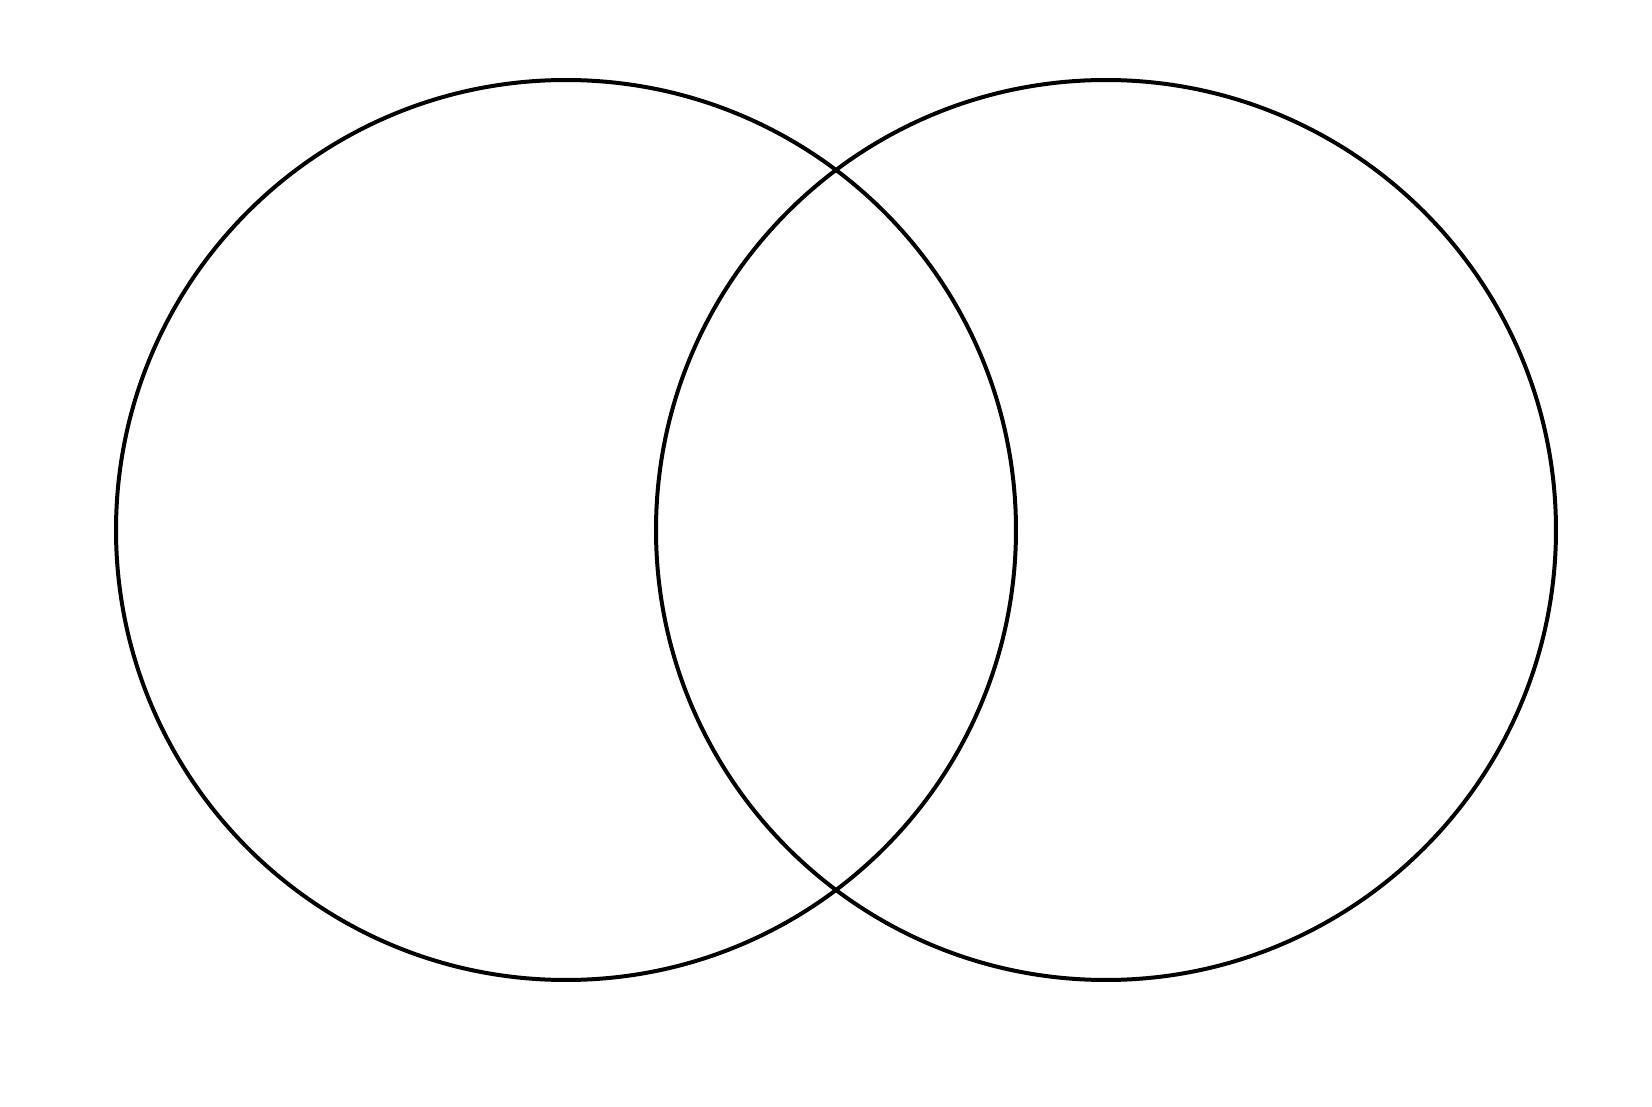
100
What does the key tell us in a pictograph? A. What the categories are B. The number of votes each picture represents C. How many people voted in total
B. The key tells us the number of votes each picture represents (E.g. 1 picture = 2 votes).
100
True or False: All our bars in a bar graph should be the same colours.
False! All our bars in a bar graph should be different colours.
100
True or False: Carroll Diagrams and Venn Diagrams are the same thing.
False! Carroll Diagrams look at 2 attributes in four ways, but Venn Diagrams look at 2 attributes in three ways.
100
Where can we collect data?
Everywhere!
200
What does the middle oval tell us in a Venn Diagram?
The middle oval tells us that the objects inside of it has the attributes in both bigger circles.
200
Mrs. W wanted to take a survey to see her students' favorite subject. What is the favorite subject in Grade 3?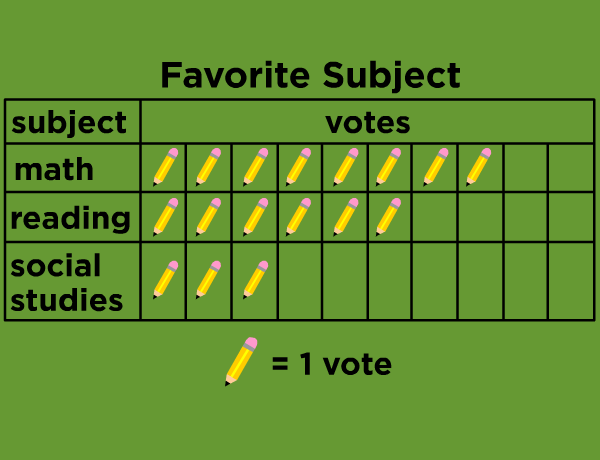
The Grade 3's favourite subject is Math!
200
What do bar graphs show us?
Bar graphs show us our data, or our information.
200
How many attributes are used in a Carroll Diagram? A. 2 B. 4 or C. 8
A. 2 - The Carroll Diagram uses 2 attributes, but each attribute is split into two different categories! For example, colour could be "Blue", and "Not Blue".
200
Mrs. T forgot again! How do you properly draw 5 tally marks?
Four in a row with the fifth going across them 
300
What are 2 examples of attributes that we can sort?
Size, shape, colour, texture, type
300
We need a side title on our Pictochart because...
... we need to know what our categories are!
300
How many titles do you need to include in a bar graph? A. 1 B. 3 C. 7
B. We need to include 3 titles on our bar graph!
300
Where would you place a pink circle in this example? 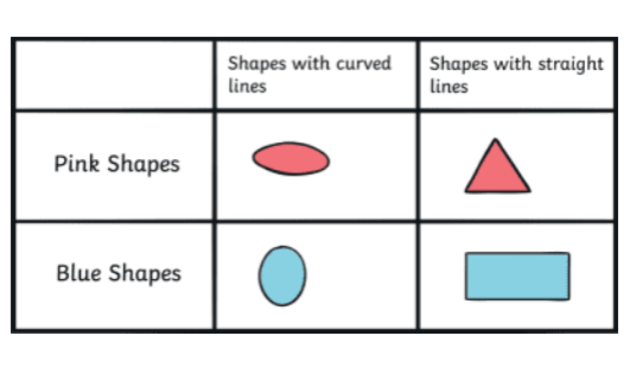
In the top left box - it has curved lines, and it is a pink shape!
300
What is another word for DATA?
Information!
400
Where would apples fit on this Venn Diagram? 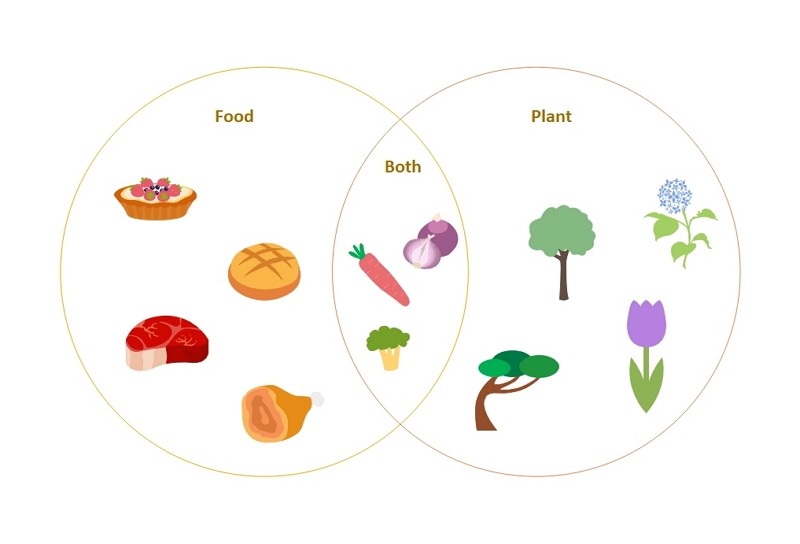
Apples would fit in the middle oval - apples are both food and a plant! Apples grow on trees.
400
How can you tell what the MODE is just by looking at a pictochart?
The mode is the category with the most votes or pictures. When I look at a pictochart, it is easy to see which category has the most pictures.
400
Why do we need a scale?
We need a scale to tell us how many each bar is worth in our bar graph.
400
Name 1 way that Carroll Diagrams are different than Venn Diagrams.
Venn Diagrams sort data in circles, but Carroll Diagrams sort them into boxes.
Venn Diagrams only have 3 spots to sort data, but Carroll Diagrams have 4 spots.
Venn Diagrams are comparing attributes in an object, but Carroll Diagrams show that some objects have some attributes, and some objects have other attributes.400
What is MODE?
Mode is the category with the MOST tallies. The category that is chosen the Most Often.
500
What do I do if something doesn't fit in any of my circles in a Venn Diagram?
I can put that object "floating" outside of my Venn Diagram!
500
Mia collected votes about her classmates favourite ice cream flavours. She has 12 votes for vanilla, but only 10 boxes in her picto-chart. What can she do to problem solve?
Mia can make 1 pictures equal 2 votes!
500
Name 4 things we need to remember to include on our bar graph.
3 titles, a scale, categories, different colours for each bar, neatly coloured bars, colouring the correct number of bars, and your names.
500
What two things can you tell me about the triangle? 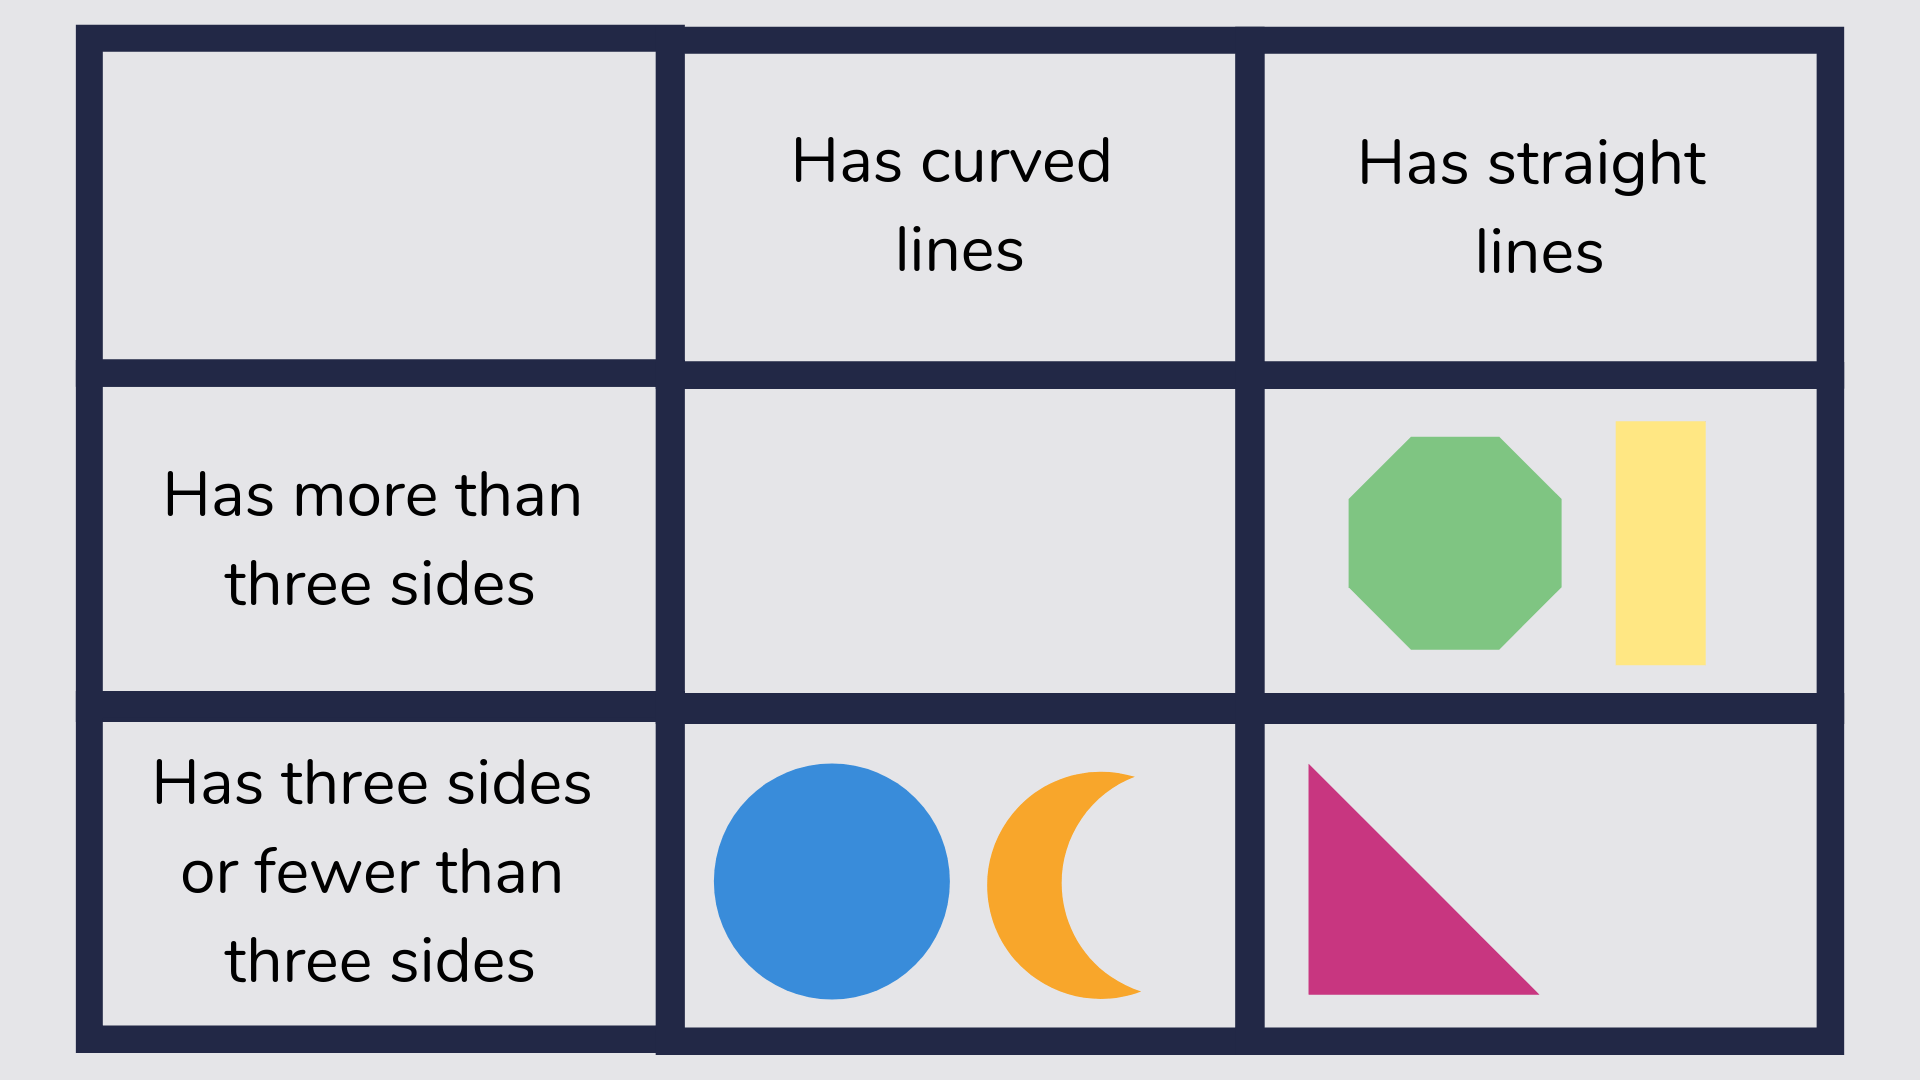
The triangle has straight lines, and has three sides or fewer than three sides.
500
Why do we need to learn about data?
We need to learn about data because it is all around us, and tells us about the world around us.