Decimals
Fractions
Data Displays
Graph
Integers
100
13.55 + 4.3
17.85
100
5/8 + 2/8
7/8
100
How much product was sold in March?

10,000
100
Where is point A

(2,3)
100
15 - 6
9
200
3.04 - 1.1
1.94
200
9/10 - 3/10
3/5
200
How many more people had cats than rabbits?
7 more people
200
Where is point G?

(-4,3)
200
-14 + 7
-7
300
23.8 x 3
71.4
300
1/4 x 2/5
1/10
300
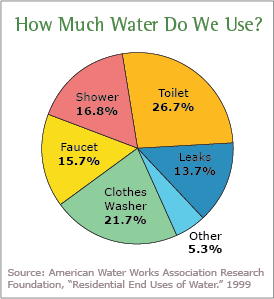
What percentage of water goes to leaks and faucet?

29.4%
300
DAILY DOUBLE:
Where is point F?

(-3,-2)
300
24 - (-12)
36
400
2.08 x 3.4
7.072
400
DAILY DOUBLE:
1/2 divided by 1/5
2.5 or 2 1/2
400
How many cars were sold on Wednesday AND Friday?
11
400
Where is point H?
(2, -4)
400
-7 x 6
-42
500
312.3 / 9
34.7
500
Change 1 4/5 to improper form
9/5
500
Is there a positive, negative, or no correlation in this scatter plot?
Positive
500
Where is point E?

(1,0)
500
-108 / -9
-12
