Statistical Questions
Dot Plots
Frequency Table/Histograms
100
Identify the statistical question:
A. How many students ate pizza for lunch yesterday?
B. How many students ate in the cafeteria this week?
B. How many students ate in the cafeteria this week?
100

Which snack represents a peak in the data?
Popcorn
100
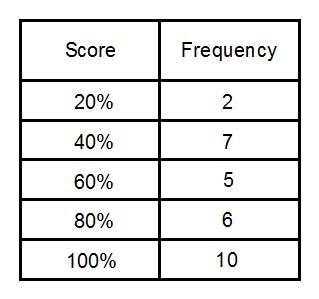
How many students scored a 60% or above?
21 students
200
Identify the statistical question:
A. What time did Mrs. Sanders' class wake up this morning?
B. Did you get up on time this morning?
A. What time did Mrs. Sanders' class wake up this morning?
200

True or False;
The shape of the dot plot is symmetric.
False
200
True or False:
When graphing a histogram, the bars touch.
True
300
The number of points a basketball player scored each game for one week is recorded. Which is not a statistical question for the situation?
A. How many points did the basketball player score in the first game of the week?
B. What is the greatest number of points the basketball player scored?
A. How many points did the basketball player score in the first game of the week?
300

True or False;
The range of the data is 4.
True
300
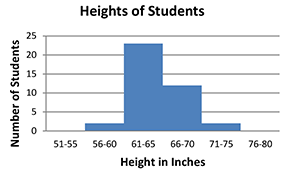
About how many students are taller than 70 inches?
About 2 or 3 students
400
Kate wants to conduct a survey on her fellow students favorite restaurants. She asks the following questions:
1. What is the best restaurant in town?
2. What is your favorite type of food?
3. Which restaurant has the best dessert?
Which questions are an example of a statistical question?
Questions 2 and 3
400

Find the median of the data.
The median is 2.
400
Which two heights have the same number of students?
56-60 inches and 71-75 inches
500
A set of data must ______ to be considered a statistical question.
(Hint: It starts with a "v")
The data must VARY!
500

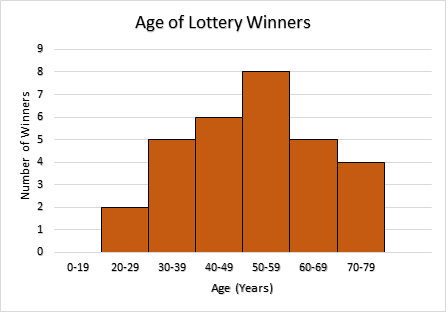
Is this data skewed right, skewed left, or symmetric?
Skewed Left

500
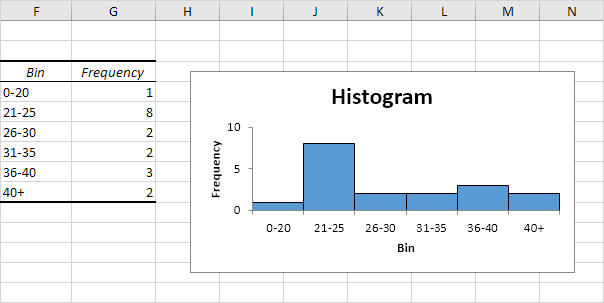
How many bins were less than 26?
9