Numerical vs. Categorical Data
Mean
Dot Plots
Mode and Range
Median
100
Write an example of a question that would give you categorical data if you surveyed the class.
Any question that provides an answer that is a a word.
Example: What's your favorite ice cream flavor?
100
Find the mean
1, 2, 3, 2, 2, 2, 1, 3
2
100
Describe the spread of this dot plot.
This dot plot has a large spread.
100
What is the range:
3,4,5,6,8,9
6
100
What is the median?
25, 44, 2, 17, 50
25
200
Write an example of a question that would give you numerical data if you surveyed the class.
Any question that provides an answer that is a number.
Example: How many hours did you sleep last night?
200
Mrs. Futia tells the class that the average score on the math vitamin was a 92%. What process did Mrs. Futia use to calculate the mean?
She added up all of the math vitamin scores and divided by the total number of students.
200
What is the center of this dot plot?
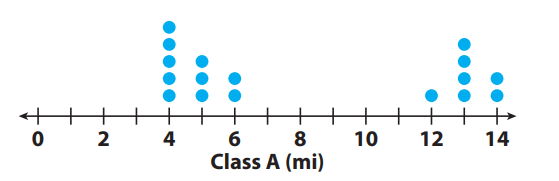
6
200
What is the range of this set:
3, 10, 4, 20, 8, 2, 6
18
200
Find the median of this set:
3, 4, 10, 5, 6, 1, 8, 2, 1
Median: 4
300
If you surveyed the class, would this question provide numerical data or categorical data?
What is your favorite type of music?
Categorical data
300
Find the mean.
5, 3, 10, 9, 2, 11, 14, 10
8
300
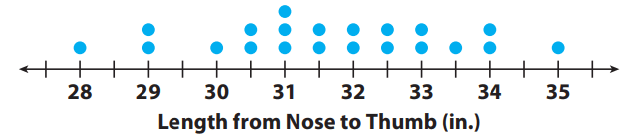
What is the center of this dot plot? 
31.5
300
What is the mode of this set:
9, 6, 4, 9, 7, 6, 4, 9, 7, 8, 9
9
300
Find the median.
3, 4, 5, 6, 7, 8, 10, 12
6.5
400
If you surveyed the class, would this question provide numerical data or categorical data?
How many siblings do you have?
Numerical data
400
Find the mean of this set. Round to the nearest tenth.
3, 5, 7, 7, 8, 8, 8
Mean: 6.6
400
Which dot plot shows more consistent scores?
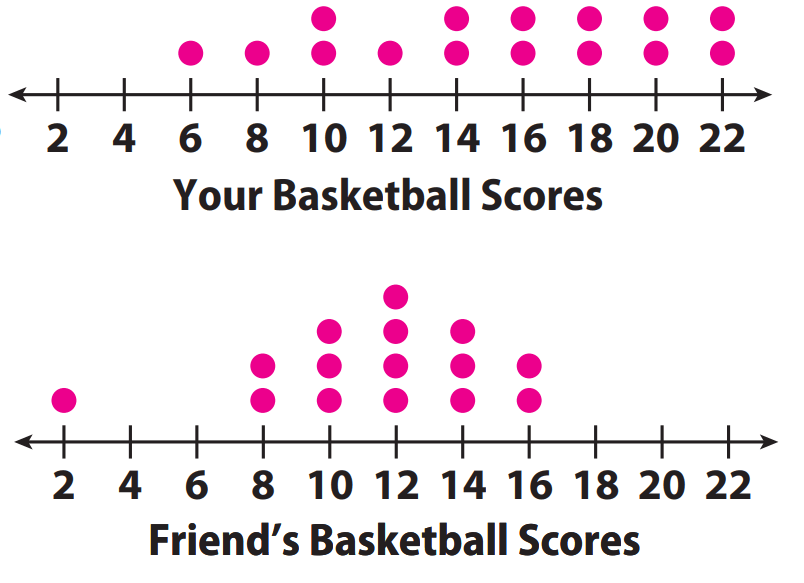
Friend's Basketball Scores
400
What is the mode of this set:
3, 4, 5, 6, 7, 10
No Mode
400
Find the median:
1, 2, 3, 2, 2, 2, 1, 3
2
500
If you surveyed the class, would this question provide numerical data or categorical data?
Do you have 2 or more pets?
Categorical data
500
Find the mean.
12, 8, 7, 10, 5, 15
9.5
500
Find the center of the dot plot AND describe the shape.

Center: 6
The dot plot looks like two mountains or two triangles.
500
What is the mode of this set:
4, 3, 7, 8, 4, 6, 6, 6, 7, 4
4 and 6
500
Find the median
45, 30, 20, 50, 23, 19
Median: 26.5