Finding MAD
Finding Mean
Median and Range
Box Plots
100
What does each letter of MAD stand for?
Mean Absolute Deviation
100
Find the Mean. 35, 56, 34, 44, 52, 12, 34, 45
Mean = 39
100
Find the Median & Range. 35, 56, 34, 44, 52, 12, 34, 45
Median = 39.5
Range = 44
100
See the box plot shown.

What is the median of the data?
76
200
Find the MAD: 10, 7 , 13, 10, 8
1.68 / 1.7
200
Find the Mean. 24, 34, 32, 16, 45, 38, 28
Mean = 31
200
Find the Median & Range. 24, 34, 32, 16, 45, 38, 28
Median = 32
Range = 29
200
Look at the box plot given.
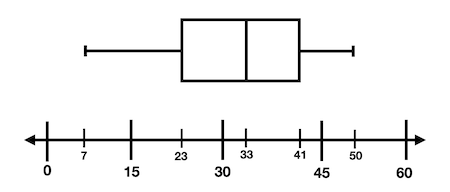
What is the range of the box plot?
43
300
Find the MAD: 110, 114, 104, 108, 106
2.88 / 2.9
300
Define: Mean
Average
300
Find the Median & Range. 86, 24, 65, 65, 24, 24
Median = 44.5
Range = 62
300
Look at the box plot shown.
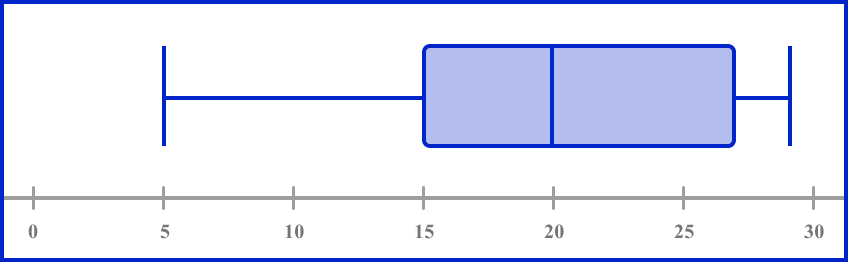
What is the Interquartile range (IQR) of this data?
11 or 12 (depending on how you looked at it).
400
Find the MAD: 5, 15, 20, 25, 5
7.2
400
Find the Mean. 86, 24, 65, 65, 24, 24
Mean = 48
400
Find the Median & Range. 32, 23, 22, 33, 33, 23, 32, 23, 22
Median = 23
Range = 11
400
Make a box plot for the following data set:
4, 6, 7, 8, 9, 10, 12, 15
Check with Mr. Bolduc
500
Find the MAD: 15, 17, 15, 17, 21, 17, 15, 23, 20, 18
2.16 / 2.2
500
Find the Mean. 32, 23, 22, 33, 33, 23, 32, 23, 22
Mean = 27
500
Define: Median & Range
Median : Middle Number
Range: The distance the data set covers
500
Make a box plot for the following information
10, 12, 15, 20, 24
Check with Mr. Bolduc