Central Tendency
Measures of Spread
Empirical
Data displays
Types of Data
100
These are the mean, median, and mode of the given data set: 2, 3, 4, 4, 4, 6, 7, 8, 8, 9, 10, 11, 12, 15 (round to 2 decimal places if needed)
What are; mean: 7.36 mode: 4 median: 7.5?
100
what measure of spread tells how far the average data point is from the mean?
What is standard deviation?
100
These are the 3 percentages associated with the Empirical Rule.
What are 68%, 95%, and 99.7% ?
100
400 people were surveyed and asked how many pets they had. The results were compiled into this frequency table. Sam wants to add a relative frequency column. What should they put in the box for the relative frequency of 3 pets?
27.5%
(should be a percent)
100
A random sampling of 100 high school students were asked what their favorite snack was.
Classify this data and categorical or quantitative
categorical
200
This is the formula for the range.
What is the largest number minus the smallest number?
200
On your calculator output, which symbol represents Sample Standard deviation,
Which one is Population Standard Deviation.
write both in this order.
Sx and
sigmax
200
Adult IQ scores have a bell-shaped distribution with a mean of 100 and a standard deviation of 15. Draw the curve for this situation labeling the mean as well as 3 standard deviations both up and down.
What is the range of data that is within 3 standard deviations of the mean?
Your curve should have following numbers;
55, 70, 85, 100, 115, 130, 145 ?
Answer: 55-145
200
What's wrong with this histogram?
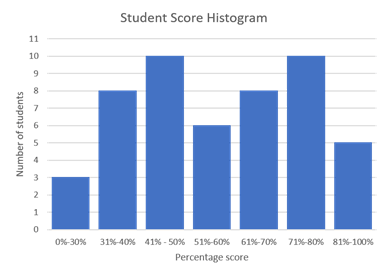
The columns should be touching. There is no bin to put a score such as 70.5 in.
200
68 students were asked how far they would be willing to drive to see their favorite band playing live.
Classify this data as categorical or quantitative
quantitative
300
In a class of 20 students, 19 students scored an A on their test, but one student scored a 20%. In order to describe the average, which calculation should be used, mean or median? Why
What is the median? The mean is resistant to outliers. The mean is greatly affected by outliers.
300
What is the range of the data that is within 2 standard deviations of the mean?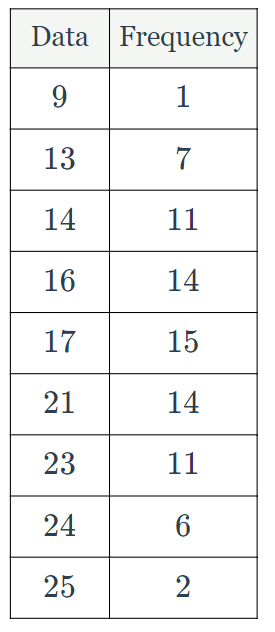
10.46 to 25.94
300
When Travis goes bowling, his scores are normally distributed with a mean of 145 and a standard deviation of 12. Using the empirical rule, what percentage of the games that Travis bowls does he score between 109 and 181?
99.7%
300
20 people were surveyed and asked if they had a retirement account. The data has been displayed in this histogram. Which column will a 50 year old's answer be recorded in?
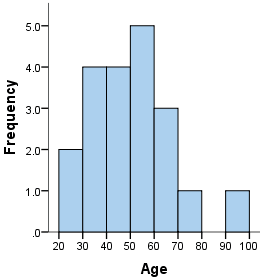
In the 50-60 column.
300
A group of 48 students were surveyed and asked which class they spend the most time studying for.
Classify this data and categorical or quantitative
categorical
The answers are still categories, not numbers
400
These are the mean, median, and mode of the given frequency distribution;
X | 30 | 33 | 40 | 50 |
f | 3 | 4 | 4 | 1 |
What are mean: 36, median: 33, mode: 33 and 40?
400
What is the population standard deviation of the data set; 2, 3, 4, 4, 4, 6, 7, 8, 8, 9, 10, 11, 12, 15. Round to 2 decimal places.
3.66
400
At a local restaurant, the amount of time that customers have to wait for their food is normally distributed with a mean of 44 minutes and a standard deviation of 3 minutes. Using the empirical rule, determine the interval of minutes that the middle 68% of customers have to wait.
(41,47)
400
The Juniors and Seniors who had a job were surveyed, asking what they spend their paycheck on. The results are displayed in this pie chart.
What was the average percent that they spent on entertainment? Round to the nearest percent. 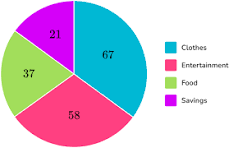
32%
400
A group of 76 students were asked how much time they spend on homework daily.
Classify this data as categorical or quantitative
quantitative
500
The class you're taking consists of 5 total tests. The first 4 chapter tests scores are 85, 90, 75, and 95. What do you need to score on the fifth test in order to have a final grade of 87.5%?
80%
500
This is the population standard deviation of the data set; 2, 3, 4, 4, 4, 6, 7, 8, 8, 9, 10, 11, 12, 15. Round to 2 decimal places.
500
Betty's flower company sells an average of 15 bouquets a day with a standard deviation of 3. This is the percentage of days will Betty sell between 9 and 18 bouquets. Assume a normal distribution. (remember the percents that went in each column)
What is 81.5% ?
500
448,000,000 people live in the European Union. The pie chart below shows percentage by country. How many people live in Spain. (In Europe, they use a comma instead of a period for decimals)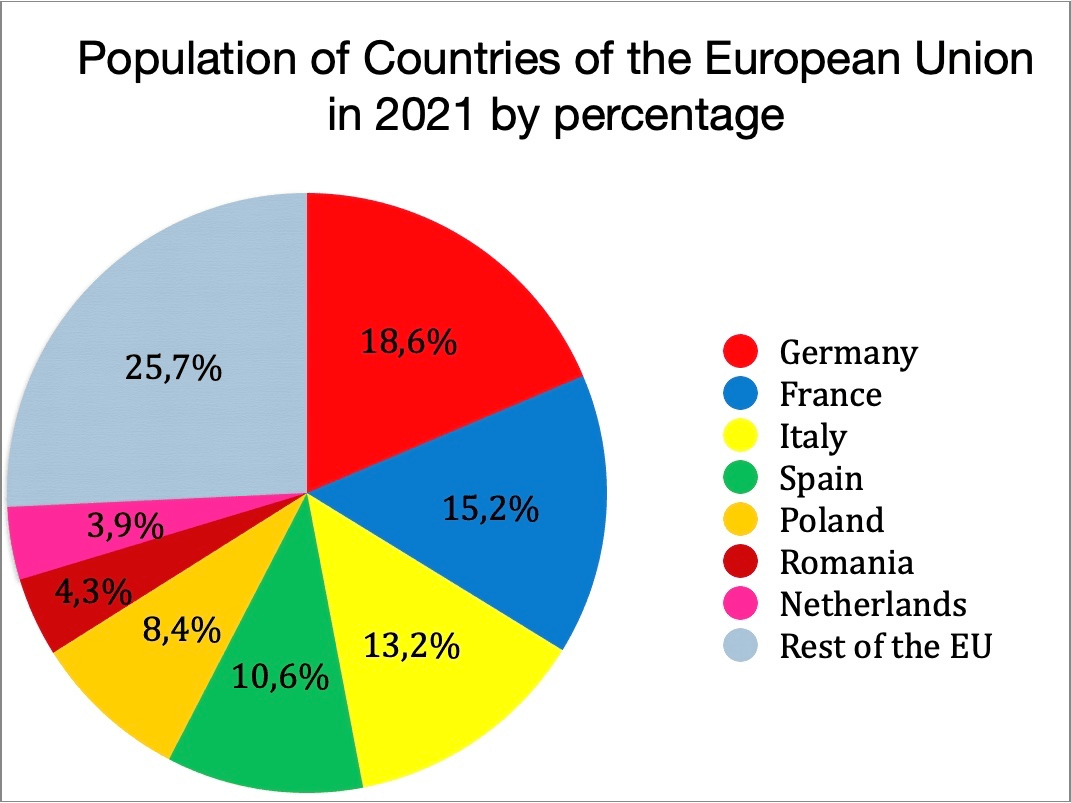
47,488,000
500
A group of 114 college students were surveyed and asked what their zip code was.
Classify this data as either categorical or quantitative.
categorical
Even though zip codes are made of numbers, they numbers itself have no value. Test: Finding the mean of all the zip codes is a meaningless task.