Migratory Miscellaneous
Carrying Capacity
Limiting Factors
Graphing
EOC
100
What are two reasons things may migrate?
- Natural disasters / Loss of habitat
- Food / water
- Breeding grounds
- Better climate / weather
100
What is carrying capacity?
The maximum number of animals/things an area can hold.
100
What is the definition of a limiting factor?
The factor that limits the population size of a species.
100
What is this graph missing?
A title
100

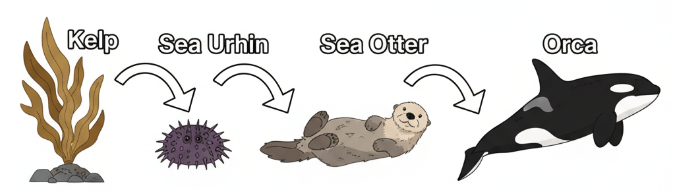
What is the primary limiting factor for the sea otter population in a healthy, balanced Pacific Northwest ecosystem?
A. The amount of available fresh water.
B. The presence of other sea otter populations nearby.
C. The number of sea urchins and other invertebrates available for food.
D. The availability of kelp for shelter and food.
C. The number of sea urchins and other invertebrates available for food.
200
If a population of deer exceeds the carrying capacity of its habitat, how will the deer population be affected?
The deer population will decrease to the carrying capacity - the maximum amount of deer that area can hold.
200
What do we look at to determine carrying capacity?
Limiting factors!
200
What are two limiting factors that could apply to any animal?
- Predators
- Space
- Disease
- Shelter
- Food / water
200
What axis does the independent variable go on? What axis does the dependent variable go on?
Independent variable goes on the x-axis. This is what we change or look at.
Dependent variable goes on the y-axis. This is what we are measuring or counting.
200
Caimans are a top predator in the Brazilian rainforest rivers. If a significant drought occurs, leading to a reduction in the size and number of river habitats, what would be the primary limiting factor for the caiman population?
A. An increase in their prey, such as fish and birds.
B. The number of other predators competing for food.
C. A decrease in the available mates for reproduction.
D. The availability of water and suitable habitat.
D. The availability of water and suitable habitat.
300
Why might the wildebeest population be decreasing in the graph from 1990 - 1995?

- Decrease in food
- Disease
- Natural disaster
- Drought
300
What statistic or calculation could we look at to determine if a population is reaching or is at carrying capacity?
Remember: if carrying capacity is at max, the population should stabilize / stay roughly the same.
Average rate of change
300
What is the minimum park size needed for a herd of wildebeest?
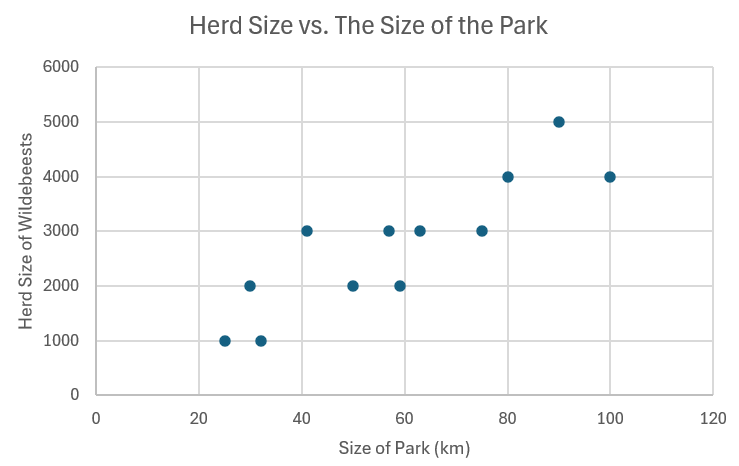
25 km
300
What are the 4 types of graphs and when do we use them?
Bar - categories
Line - time
Pie - percentages
Scatter - relationships / correlations
300

In the Pacific Northwest, sea otters are considered a keystone species. If a disease significantly reduces the sea otter population, what is the most likely long-term effect on the kelp forest ecosystem?
A. The sea urchin population will increase, leading to a decline in the kelp forest.
B. The orca population will increase as their food source, sea otters, becomes more available.
C. The kelp forest will thrive due to reduced competition for nutrients.
D. The population of fish that eat kelp will increase, leading to a decline in the kelp forest.
A. The sea urchin population will increase, leading to a decline in the kelp forest.
400
If grass is a limiting factor of wildebeests, what would the graph look like if you were to graph the amount of grass and the number of wildebeests in the area?
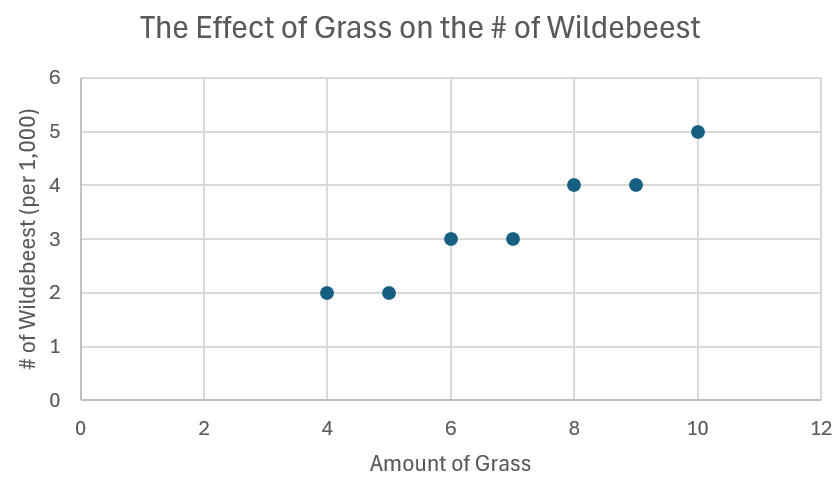
400
If there is a limiting factor of space in the ocean, what would happen to the blue whale carrying capacity if the ocean started to increase in size?
The carrying capacity may increase as there is more space for them to live.
400
In Yellowstone, deer run rampant in the park. In 1995, wolves were reintroduced to the park. Deer mainly feed on grass and berries, and the park is 3,472 square miles.
What is the main limiting factor of deer?
Predators (wolves)
400
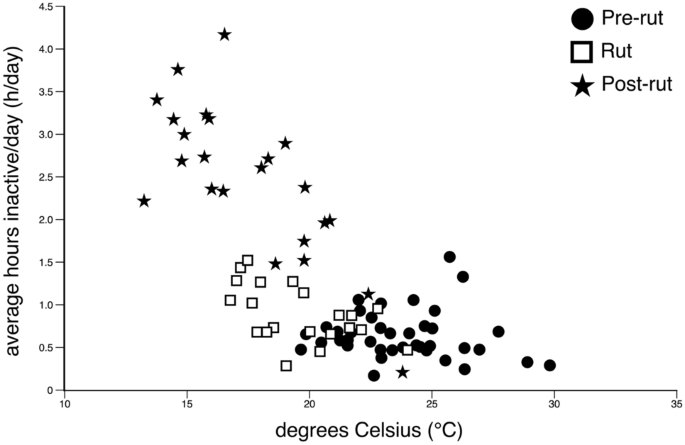
Describe the relationship between hours inactive per day and temperature using the scatter plot below.
Weak negative relationship
400
In the Brazilian rainforest, a species of monkey is a specialist feeder on a specific type of fruit. A change in climate leads to a decrease in the reproductive rate of the fruit tree species. Which of the following is the most likely cascading effect on the monkey population?
A. There will be no significant change, as the monkeys can easily switch to other food sources.
B. The monkey population's carrying capacity will be reduced due to a decrease in their food source.
C. The monkey population will increase due to less competition for other food sources.
D. The monkey population will move to a new area with more of their food source.
B. The monkey population's carrying capacity will be reduced due to a decrease in their food source.
500
A population of deer lives in a forest ecosystem with abundant water and shelter, but limited food supply. Over several years, conservation efforts increase the availability of food, causing the deer population to grow rapidly. However, after a few more years, the population stabilizes and stops growing—even though food, water, and shelter are still plentiful.
Why did the deer population stop growing?
The space in the forest ecosystem became limited.
500
Give a real life example of carrying capacity that could occur in every day life.
Examples:
- My car'c carrying capacity is 5 people.
- My classroom's carrying capacity is 27 students.
- My shoe's carrying capacity is 7 inches of foot.
- My aquarium's carrying capacity is 10 gallons of water.
500
Thinking about a family in America, what are some limiting factors that may limit the size of a family?
- Money
- Ability to have children
- The desire to have children
- Space in a house/apartment
500
Using the data table below, draw/outline a graph that could represent all of the data.
Color | # of Wildebeest
Blue 30
Black 5
- Bar Graph
- Title: Color of the Wildebeest vs. # of Wildebeest
- X-axis: Color, Y-axis: # of wildebeest
- 2 bars, y-axis should go up to 30
500
The carrying capacity of a Pacific Northwest kelp forest for sea urchins is limited by the availability of kelp. If an environmental change causes a significant reduction in the kelp population, which mathematical representation would best model the impact on the sea urchin population?
A. A graph with a positive slope, showing a linear increase in the sea urchin population.
B. A graph with a horizontal line, indicating that the sea urchin population remains constant despite the change.
C. A graph with an exponential curve, showing a rapid, uncontrolled increase in the sea urchin population.
D. A graph showing the sea urchin population stabilizing at a new, lower carrying capacity.
D. A graph showing the sea urchin population stabilizing at a new, lower carrying capacity.