JOINT, MARGINAL, CONDITIONAL PROB, INDEPENDENCE VS DISJOINT
Bayes Theorem
Counting
Methods
Methods
Univariate Data
Bivariate Data
100
Is this statement about conditional probability true or false? Why?
"In general, P(A|B) = P(B|A). You can reverse the order and the probability is the same either way."
This statement is false. The “given condition” is different for the two probabilities, so the conditional probabilities will be conditional on different events, thus they are generally not true.
100
A person uses his car 30% of the time, walks 30% of the time and rides the bus 40% of the time as he goes to work. He is late 10% of the time when he walks; he is late 3% of the time when he drives; and he is late 7% of the time he takes the bus.What is the probability the person is late?
0.30*0.10+0.3*03+0.4*0.07
100
Determine whether you would use permutations or combinations to solve this problem:
Selecting five students to attend a State conference.
Selecting a first play winner and a second place winner.
There are 45 applicants for three Computer Programmer positions.
A group of 25 people are going to run a race. The top 8 finishers advance to the finals.
The number of codes that can be made out of 4-numbered lock
Combination
Permutation
Combination
Combination
Permutation
100
Six homes are for sale and have the following dollar values in thousands of dollars:
535
155
305
720
315
214
What is the median value of the six homes?
(305+315)/2= 310
100
Here is a set of data relating the temperature on days in July, and the number of ice creams sold in a corner shop.
Temp: Ice Cream Sales:
15 12
16 17
17 10
18 14
19 16
20 11
1. Find the sample average temperature.
2. Find the sample median temperature.
a)15x12+16x17+17x11+18x14+19x16+20x10/ 80
b) 80/2= 40
Ans= 18
200
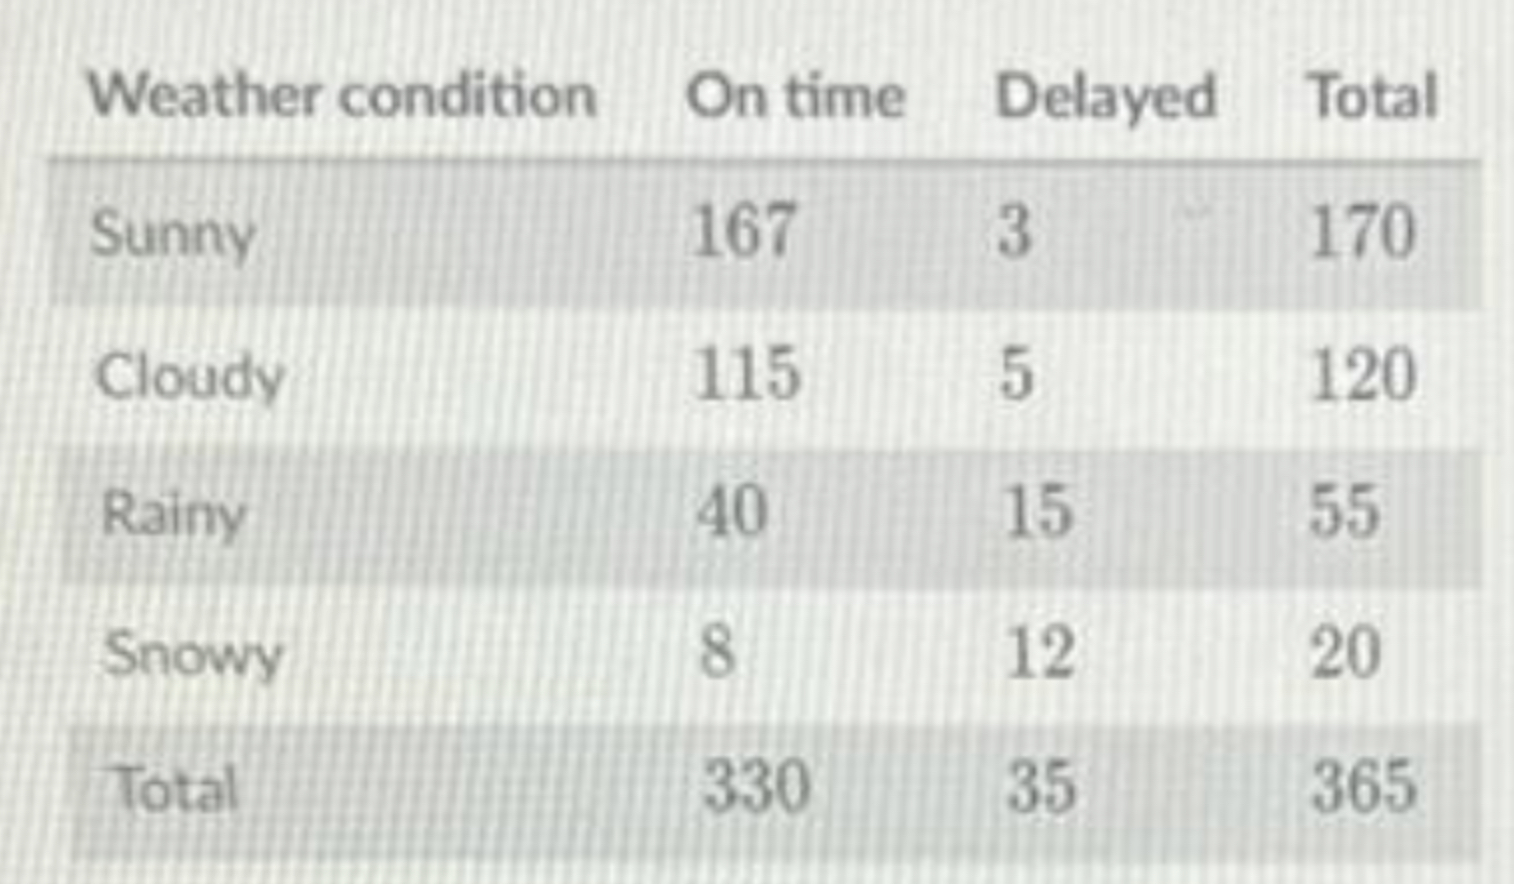
James is interested in the relationship between weather conditions and whether the downtown train runs on time. For a year, James records the weather each day as well as whether this train arrives on time or is delayed.
For these days, are the events “delayed” and “snowy” independent? Why or why not?
We know that if events A and B are independent of each other, then
P(A|B) = P(A)
Or P(B|A) = P(B)
This is because when the events are independent of each other, Event A does not affect B so , and so P(A|B) = P(A∩B)/P(B) = P(B).
Here, we check if P(snowy|delayed) = P(snowy) (or you can do vice versa)
P(snowy|delayed) = 12/35 = 0.34
P(snowy) = 20/365 = 0.05
Clearly, the two probabilities do not equal each other, and thus the events “delayed” and “snowy” are not independent of each other.
200
Assume the probability of having tuberculosis (TB) is 0.0005, and a test for TB is 99% accurate. What is the probability one tests positive for the disease?
(0.0005)(0.99)+(0.9995)(0.01)
200
A state lottery game awards a jackpot to any player who correctly guesses four (distinct) numbers from thirty possible numbers. The lottery employee picks four numbers at random from 1, 2, . . . , 30 (without replacement).
(a) If a player randomly chooses her four numbers, what is the chance that she wins the jackpot?
(b) If a player randomly chooses her four numbers only from 1, 2, . . . , 10 (since she likes small numbers), what is the chance that she wins the jackpot?
A.There are (30C4) possible combinations of four numbers, so she has a 1 / (30C4) or (4·3·2·1)/(30·29·28·27) chance.
B. Since any combination is equally likely, the answer is the same as part (a).
200
A bird watcher observed how many birds came to her bird feeder for four days. These were the results:
Day 1: 15
Day 2: 12
Day 3: 10
Day 4: 13
What is the Standard Deviation number of birds?
15+12+10+13=50
50/4=12.5
√ ((15-12.5)^2 + (12-12.5)^2 +(10-12.5)^2+(13-12.5)^2 / 4-1)
200
Here is a set of data relating the temperature on days in July, and the number of ice creams sold in a corner shop.
Temp: Ice Cream Sales:
15 12
16 17
17 10
18 14
19 16
20 11
1. Inter Quantile Range for temperature
2. Standard Deviation for temperature.
1. Q3-Q1
2. ∑ Frequency x (deviation)^2 / n-1
300
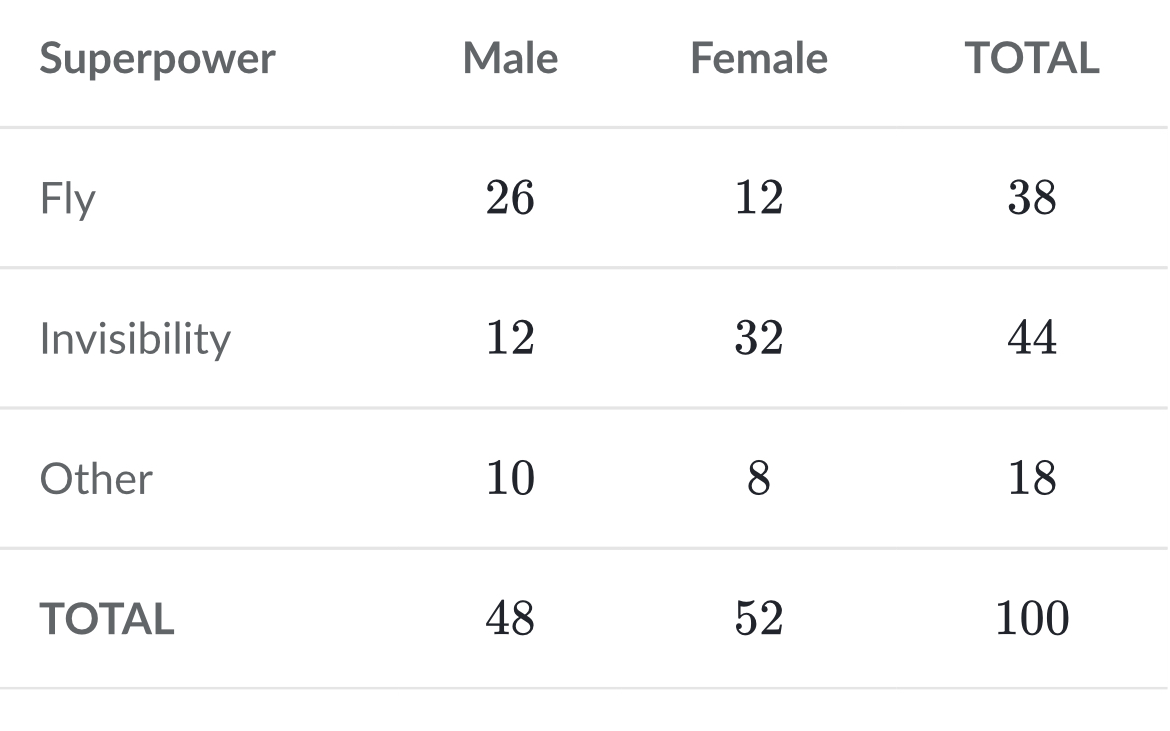
Researchers surveyed 100 students on which superpower they would most like to have. This two-way table displays data for the sample of students who responded to the survey:
Students are chosen at random.
Find the probability that the student chose to fly as their superpower.
Find the probability that the student was male.
Find the probability that the student was male, given the student chose to fly as their superpower.
Find the probability that the student chose to fly, given the student was male.
What type of probability were a, b, c, and d
1. There were 38 students in the sample who chose to fly as their superpower out of 100 total students. Therefore, P(fly) = 38/100 = 0.38
2. There were 48 students in the sample who are male out of 100 total students. Therefore, P(male) = 48/100 = 0.48
3. The condition is that the student chose to fly as their superpower. There were 38 total students in the sample who chose to fly, and 26 of them were male. Therefore, P(male|fly) = 26/38 = around 0.68.
4. The condition is that the student is male. There were 48 total male students in the sample, and 26 of them chose to fly. Therefore, P(fly|male) = 26/48 = around 0.54.
5. Questions (a) and (b) were about marginal probabilities, and questions © and (d) were about conditional probability.
300
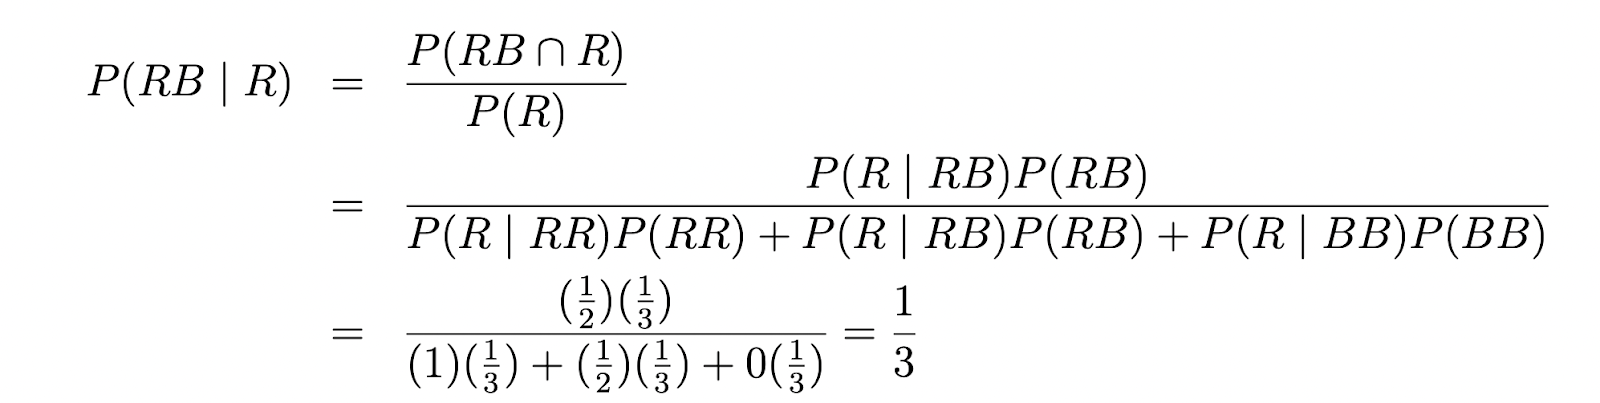
Suppose we have 3 cards identical in form except that both sides of the first card are colored red, both sides of the second card are colored black, and one side of the third card is colored red and the other side is colored black.
The 3 cards are mixed up in a hat, and 1 card is randomly selected and put down on the ground. If the upper side of the chosen card is colored red, what is the probability that the other side is colored black?
300
A business magazine rates S&P 500 mutual fund managers based upon how often their fund beats the return on the S&P index. Assume that any manager has a 50% of beating the S&P index in a given year (and 50% of not beating it), and assume that each year’s performance is mutually independent.
The magazine gives its “Silver Star” rating to any manager who has beaten the S&P index in exactly four of the last six years. What is the probability of any given manager getting the “Silver Star” rating?
There are (6C4) = 15 combinations of the years in which the manager beats the S&P.
For each of the combinations, the probability of that combinations occurring is (0.5)^4 * (0.5)^2 = 1/64. So, the probability of a “Silver Star” rating is 15/64 (15* 1/64).
300
Number Crunchers Inc. has offices in New York and Wisconsin. The mean salary for office workers in New Work is $28,500. The mean salary for office workers in the Wisconsin office is $22,500. The New York office has 128 office workers and the Wisconsin office has 32 office workers. What is the mean salary paid to the office workers in Number Crunchers Inc.?
The total amount paid in salaries to the office workers is 128($28,500)+32($22,500)=$4,368,000
which is paid to 128+32=160 office workers.
Thus, the mean salary paid to office workers is 28,500*128+22,500*32/ 128+32 = 27,300
300
On R, you are provided the following information. ‘Students’ represents the number of students in a university, and ‘professors’ represents the number of professors in a university.
sd(students)
[1] 20
Professors
[1] (50, 100, 100, 50, 200)
mean(professors)
[1] 100
Cov (students, professors)
[1] 2,000
What is the sample correlation between ‘students’ and ‘professors’? How do you interpret the magnitude and sign of this correlation?
X = students
Y = professors
R = S(xy) / S(x)*S(y)
S(xy) = covariance of students and professors, given to you = 200,000
S(x) = variance of students, take the square of sd(students) = 400
S(y) = self calculate, by taking each data point in ‘professors’ minus the mean of professors. Then you take the sum of the square of all those differences
(50-100)^2 + (50-100)^2 + (100-100)^2 + (100-100)^2 + (200-100)^2 = 15,000
R = 200,000 / (400*15000) = 0.0333
There is only a +3.33% correlation between the number of students and the number of professors. This is a small, positive correlation.
400
A small information systems firm has the resources to respond to two invitations to submit a proposal for a contract. When a proposal is submitted, it may be accepted outright, rejected outright, or a revision of the proposal may be requested. If a revision is requested, submission of the revision will then lead to acceptance or rejection. You may assume that the firm always submits a revision if it is requested. Define the event A to be “both proposals are eventually accepted,” the event B to be “both proposals are eventually rejected,” and event C to be “a revision is submitted.”
a.Are A and B disjoint events? Are A and B collectively exhaustive? Independent? Why?
b.Are A and C disjoint events? Are A and C collectively exhaustive? Independent? Why?
Yes. No. No. The two events cannot happen simultaneously, so they are disjoint. However, they do not represent the entire sample space, so they are not collectively exhaustive. And if A or B happens, the other event is bound to not happen, thus the events are dependent on each other
No. No. No. The two events can happen at the same time. They do not represent the entire sample space. And, event C can event A’s probability of occurring.
400
On a game show, a contestant can select one of four boxes.
The red box contains one $100 bill and nine $1bills.
A green box contains two $100 bills and eight $1 bills.
A blue box contains three $100 bills and seven $1 bills.
A yellow box contains five $100 bills and five $1 bills.
The contestant selects a box at random and selects a bill from the box at random. If a $100 bill is selected, find the probability that it came from the yellow box.
(0.25)(0.50)
—----------------------------------
(0.25)(0.10)+(0.25)(0.20)+(0.25)(0.30)+ (0.25)(0.50)
≐0.455
400
You have 16 chips - 6 red, 7 white, 3 blue. Four chips are selected without replacement.
What is the probability of picking no red chips
What is the probability of at least 1 chip of each color?
Total possible selections (16C4) Possible selections, no red: (10C4) P(no red chips) = (10C4) / (16C4) = 0.1153
This can happen if 1 red, 1 white, 2 blue or 1 red, 2 white, 1 blue or 2 red, 1 white, 1 blue
Thus, P(At least on chip of 1 color) =
[(6C1)*(7C1)*(3C2) / (16C4)] + [(6C1)*(7C2)*(3C1) / (16C4)] + [(6C2)*(7C1)*(3C1) / (16C4)] = 0.45
400
On R, you have been given the following command about the average wage earned by Lilliput Citizens:
summary ($avgwage)
Min: 3
1st Quantile: 10.5
Median: 15.5
Mean: 16.75
3rd Quantile: 27.3
Max: 55
NAs: 100
Find the Lower and Upper Whisker of the data.
Upper Whisker= 27.3+1.5(27.3-10.5)
Lower Whisker= 3
400
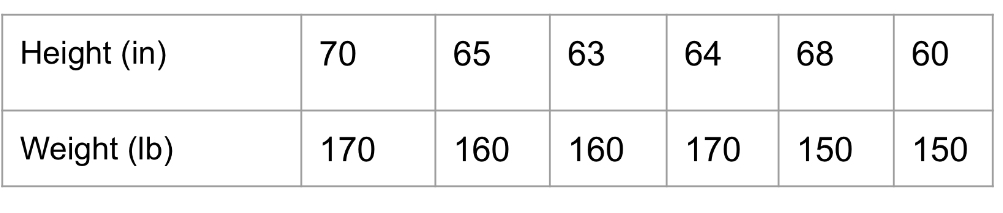
Your friend believes that he has a unique theory on weight and height in affecting grades. He samples Austinites for their heights and weights, shown on the table. You also are told that the sample standard deviation of height is 3.578 in, the sample standard deviation of weight is 8.94 lbs, and the standard covariance between height and weight is 51.2.
(a) Your friend’s theory is that grade point average is given by GPA = -50 + 2*weight - 4*height. Using your notes from linear transformations of bivariate data, what are the sample mean and sample standard deviation of GPA? Your are given that the standard covariance between height and weight is 51.2,
(b) If new research came out disproving that height and weight are dependent on one another, how would the sample mean and standard deviation of GPA change (from above)?
a.sample mean is GPA = (-50) + 2*160 - 4*65 = 10
Standard dev = sqrt(4*(3.578)^2 + 16*(8.94)^2 - 2*(2)*(-4)*(51.2)) = 46.37
B. Standard mean would be the same. Because the two variables are independent of each other, the covariance between height and weight =0. Thus this would drop the (+2*a*b*cov(x,y)) term, thus decreasing the standard deviation of GPA by 819.2