Probably, Maybe.
What's Normal Anyway?
Care for a Sample?
Test Time!
But what does it mean?
100
relative frequency of occurrence of an event or outcome.
What is Probability
100
a theoretical or ideal model that was obtained from a mathematical equation.
What is a Normal Curve
100
A set of individuals who share at least one characteristic.
What is a population
100
Researchers deal with the uncertainty in estimating the standard error of the mean with this distribution
t-distribution
100
Test hypothesis with a single group mean in a population variance with an unknown variance.
One sample
200
True or False: A probability varies from 0 to 10
False
200
True or False:
100% of scores fall under the area of a normal curve.
True
200
100% of members in this type of sample have an equal chance of being selected.
What is a Random Sample
200
Standard confidence interval in social science.
.05
200
Cohen's d effect sizes
Small = <.2
Medium = .2 < d < .8
Large = >.8
300
The probability of getting a 5 option question right.
What is .20
300
Characteristics of a normal curve
Symmetrical, unimodal, extend indefinitely in both directions
300
Every nth member of the population is taken from a list and included in the sample.
What is systematic sampling
300
Claiming significance when there is none
What is Type I error
300
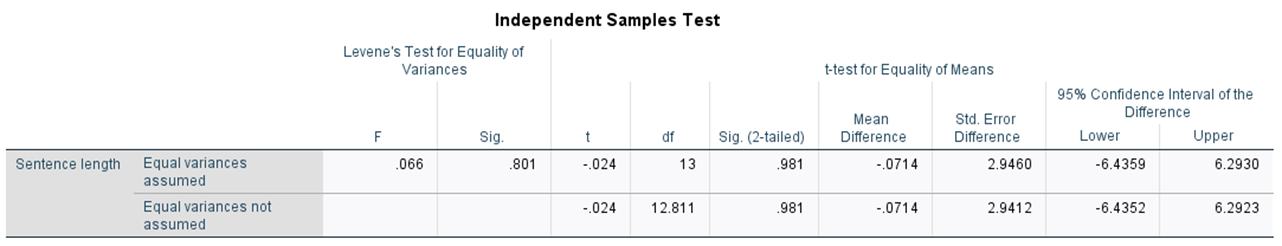
Identify the t-value and degrees of freedom
-.024, 13
400
A probability of 0.
What is an impossible event
400
____ is to theoretical events as ____ is to actual events.
Normal distribution; Frequency Distribution
400
These two types of sampling require breaking the population into smaller groups before drawing a sample.
Cluster and Stratified
400
Sampling error is not responsible for obtained differences
Reject the Null Hypothesis
400
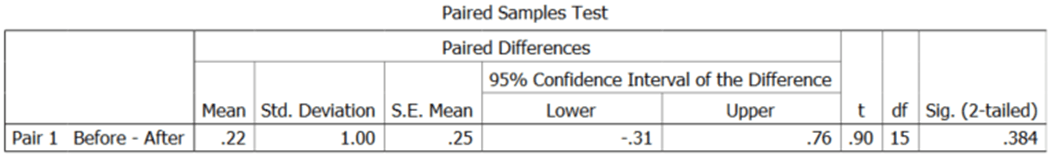 Identify the difference between means.
.22
500
The probability of obtaining any one of several different and distinct outcomes.
What is the Addition Rule
500
True or False:
A normal curve can be skewed.
False
500
The inevitable difference between a random sample and its population.
What is Sampling Error
500
____ is to difference between means as _____ is to no difference between means
Alternative, null
500
Determine the significance.
Not significant. Fail to reject null