Qualitative vs. Quantitative
Bar Graphs
Stem & Leaf Plots
Box Plots
Measures of Central Tendency
100
Hair color is an example of which type of data?
Qualitative Data
100

How many students like baseball the best?
6 people
100
Make a stem and leaf plot for the following data:
34, 45, 41, 56, 67, 70, 71
________
3 | 4
4 | 5 1
5 | 6
6 | 7
7 | 0 1
Key: 5 l 6 = 56
100
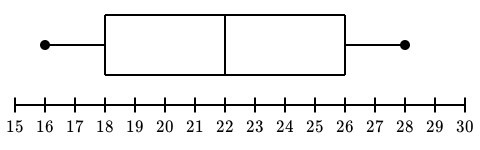
What is the MEDIAN?
22
100
22 , 22 , 18 , 27 , 8
what is the mean ?
19.4
200
Give two examples of quantitative data.
height, weight, age, distance, speed, ...
200
How many total students are there?
29 students
200
All stem and leaf plots must have a key
True
200
What is the MINIMUM?
16
200
12 , 13 , 16 , 18, 13 , 12 , 19 , 20
What is the median in the problem?
15.5
300
What is the difference between qualitative and quantitative data?
Qualitative is categorical and quantitative is measured
300
How many more students like Soccer than Basketball?
9 - 7 = 2 students
300
Stem__Leaf (5 | 6 = 56)
3 | 4 4 6
4 | 5 1
5 | 6 1 9
What is the mode of the data?
34
300
What percent of the data is between 18 and 22?
25%
300
17 , 18 , 19 , 15 , 20 , 21 , 15
What is the mode ?
15
400
What is the most favorite sport?
SOCCERRRRRRR (Football ;)
400
What is the IQR?
26-18 = 8
400
9, 8, 4, 6, 5, 6
Which measure of central tendency is different from the other two?
The mean (mode and median are both 6)
500
What percent of the data is less than 26?
75%