Regression Models
Correlation Coefficient
Deviation
Shape
Center
100
y = 3.5x+19 is the linear regression for the amount of time in years it takes for a plant to grow, in inches. What does the slope mean, in context?
The plant grows 3.5 inches every year.
100
What does this residual plot tell you about your linear model?
Should have used a non linear model
100
What does standard deviation tell us?
How far data is away from the mean.
100
Describe the mode and skew of this data. 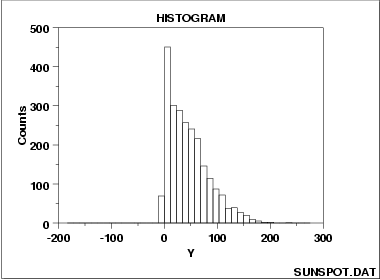
Unimodal, skewed right.
100
What are the two measures of center?
Mean and Median
200
(7, 8) , (1, 6) , (6, 7) , (9, 9) , (15, 0)
What is the linear regression equation we would use for this data?
y = -0.417x+9.17
200
If the residual plot UNDERESTIMATES THE DATA, where will the data points lie?
Above the line
200
Ms. Kimora's class had an average score of 95 on their test, with a standard deviation of 15 points.
Mr. Black's class had an average score of 87 on their test, with a standard deviation of 5 points.
Which class was more consistent? How do you know?
Mr. Black's class because the deviation was lower.
200
Describe the shape of this data. Include symmetry and skew. 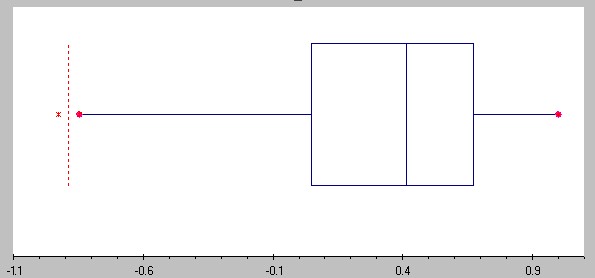
Non symmetrical, skewed left
200
Calculate the measures of center for: 5, 8, 2, 6, 9, 3, 4, 7, 1, 0, 15, 6
Median: 5.5
Mean: 5.5
300
Your regression equation is y = 4x - 7. What does your model say as the output, when x = 13?
y = 45
300
Which correlation coefficient BEST fits the graph below? r=-0.67, r=0.99, r=-0.24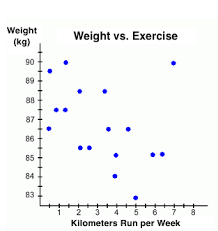
r=-0.67
300
Mrs. Mattel's project scores were 4, 7, 8, 14, 5, 7, 12, 3, 12, 12, 12, 9, 8, 10.
What was the standard deviation of this data? What does that mean?
ROUND TO THE NEAREST HUNDREDTH
Sx = 3.378
This means that on average, each piece of data was 3.378 units away from the mean.
300
Describe the shape of this data. Include the range and mode. 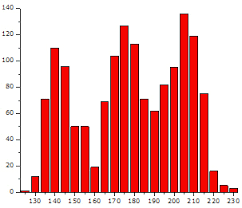
Range: 105, Multimodal,
300
30, 55, 77, 14, 17, 28, 37, 26, 15, 28, 39, 3
Is there an outlier for this data? If so, what is it?
(Hint: 1.5(IQR) rule)
77 is an outlier
400
What is the exponential regression for the data?
Data: (0, 4400) , (10, 5100) , (17, 5852) , (20, 6090) , (25, 6450)
y = 4401.299(1.016)x
400
What is the correlation coefficient for a LINEAR model? For an EXPONENTIAL model? Which model should you use?
(0, 4400) , (10, 5100) , (17, 5852), (20, 6080) , (25, 6465)
Linear r=0.99675
Exponential r=0.998
Pick exponential, the r is stronger so it fits the data better
400
The average critic reviews of a certain superhero movie are as follows: 87, 88, 56, 73, 100, 96.5, 77.7, 80, 90.5.
What is the standard deviation for this data set? What does this tell us about the shape of this data?
ROUND TO THE NEAREST HUNDREDTH
Sx= 13.39
This data is fairly spread out.
400
Calculate the 5 number summary for: 5, 8, 2, 6, 9, 3, 4, 7, 1, 15, 6, 0
(min)Q1: 0
Q2: 2.5
(median)Q3: 5.5
Q4: 7.5
(mX)Q5: 15
400
Which data set, Forest A, B, or C, has the highest median? Which has the largest spread? 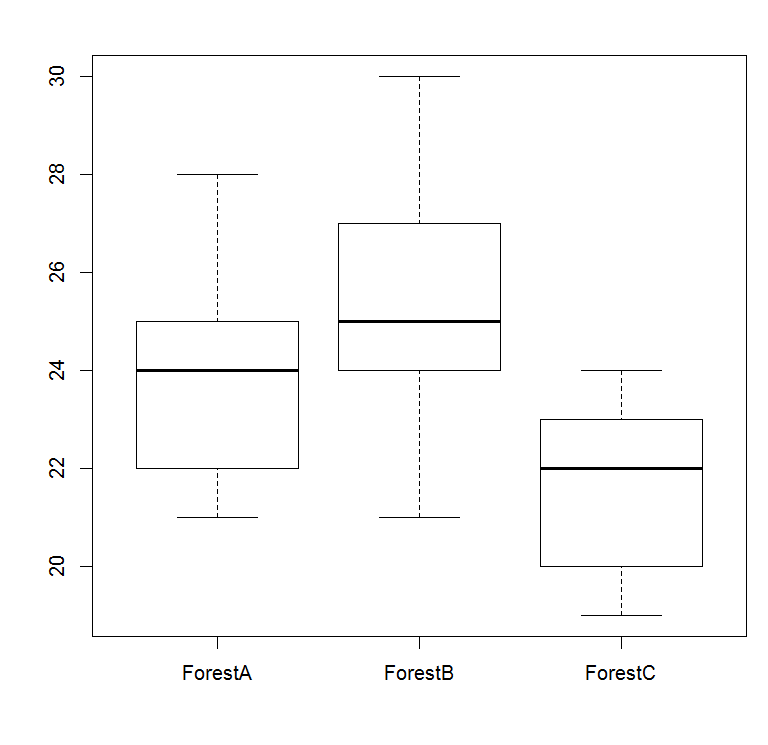
B for both
500
Data: (0, 4400) , (10, 5100) , (17, 5852) , (20, 6090) , (25, 6450)
What does your linear model say your output should be at x = 17? What is your residual here?
y = 5798.2108
Residual: +53.79
500
SURPRISE
Of the people that Do Not Like Skateboards, which percent Like Snowmobiles? 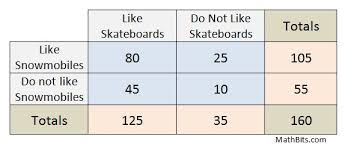
71%
500
Data Set A: 1, 2, 3, 4, 5, 6, 7, 8, 9, 8, 7, 6, 5, 4, 3, 2, 1, 10, 16
Data Set B: 19, 18, 17, 16, 15, 14, 16, 17, 18, 17, 16, 15, 16, 17
Which set of data had a lower standard deviation? By how much?
ROUND TO THE NEAREST HUNDREDTH
Data set B, by 2.33
500
LUCKY YOU
What is the square root of 36
6
500
Data set: 3, 14, 15, 17, 26, 28, 28, 30, 37, 39, 55, 77.
77 is an outlier. If we were to take it out, what would happen to the mean and median?
Mean would decrease by ~4
Median would stay the same