Write the Equation
Tables and Graphs
Linear, Quadratic, or Exponential?
Types of Correlation
Correlation or Causation
100
Write the equation with a rate of change of ⅓ and a y-intercept at (0, -4)
y=1/3x - 4
100
The scatter plot shows the price, in cents, of a postage stamp used to mail a letter in the United States for the years from 1958 to 2014. Also shown is a line of fit to model the data.The equation of the line of fit is y=0.86x−0.71, where y represents the predicted price, in cents, of a stamp and x represents the number of years since 1958. What does 0.86 represent?
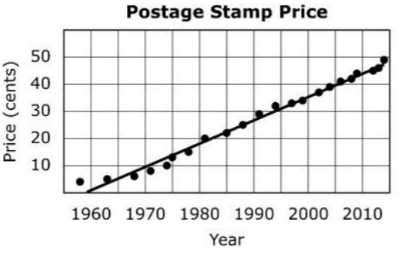
yearly price increase of a stamp
100
The number of members in a club (Y) that doubles in size every (x) years
Linear
100
Between what two numbers will the correlation coefficient be between?
-1 and 1
100
Correlation or causation:
As the number of high schools increases, the number of enrolled students goes up?
Correlation (just because there are more schools, doesn’t mean there are more students to fill them)
200
write the equation for a line with an initial value of 5 and the average rate of change is -1
Y=-1x +5
Or
Y= -x+5
200
Select all situations that could be represented by a graph with a y-intercept of 10.
A. CityCable TV has a sign-up fee of $10 and a monthly charge of $19.99 where y represents the cost, in dollars, for using CityCable TV after x months.
B. Lily starts with $10 in her savings account and adds $20 to it each month where y represents the amount, in dollars, in Lily's account after x months.
C. Leon is running at 10 miles per hour where y represents the distance, in miles, Leon runs after x minutes.
D. Patty is playing a video game and scores 10 points for each level she completes where y represents the number of points Patty scores after x levels.
A, B
200
The value of an investment (y) that began with $500 and earns 4.25% each year
exponential
200
What type of correlation would you expect between the number of minutes a candle burns and the height of the candle?
Negative or Positive?
Negative
200
Correlation or causation:
As the number of weddings increase, the number of marriage licenses increases
Causation (actually legally causes it to happen)
300
Write an equation for the situation:
A plant started at 1 inch tall and grew .25 inches each week
y=o.25x + 1
or
y=1/4x + 1
300
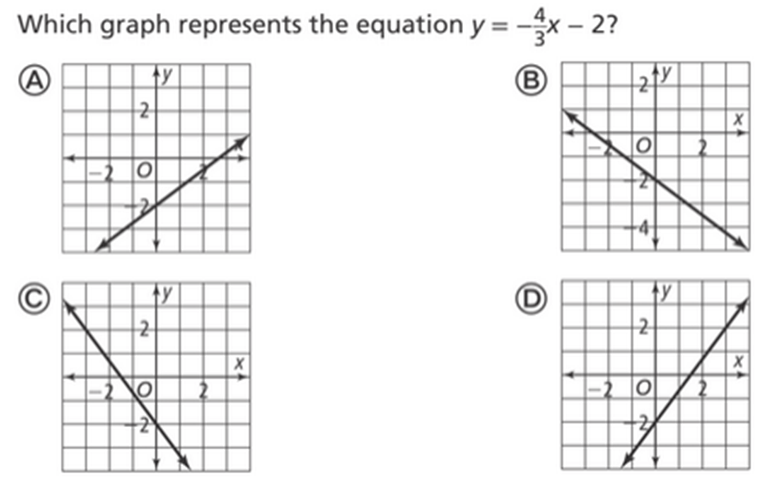
C
300
A student receives $50 each year for his birthday.
linear
300
What does the correlation coefficient of -0.975 indicate about the type of correlation?
Strong or weak?
Negative or positive?
Strong Negative
300
Correlation or causation:
The amount of time a candle burns and the height of the candle after burning
Causation (a candles can only get smaller when it burns)
400
Write an equation for the situation:
Amanda has $550 in her bank account and earns $30 each week for chores.
Y= 30x + 550
400
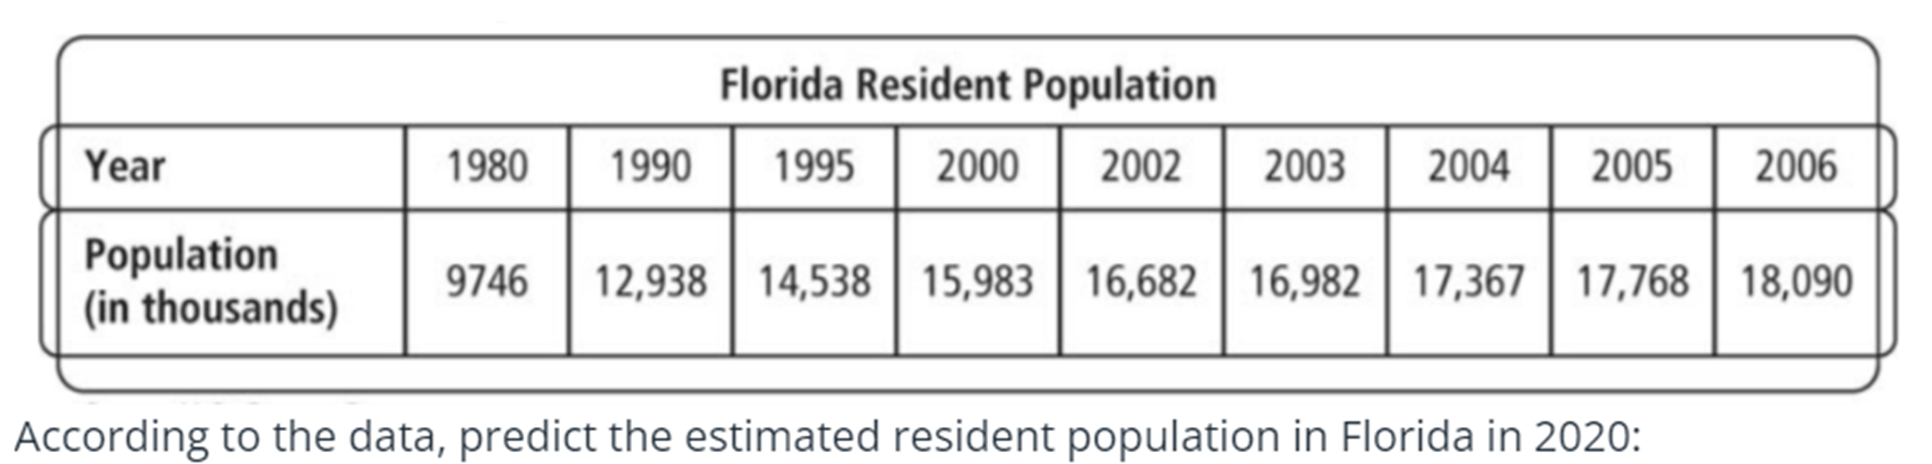
22328
400
The total cost (y) to purchase (x) number of tickets to a sporting event if a 20% service charge is added to the cost of each ticket
exponential
400
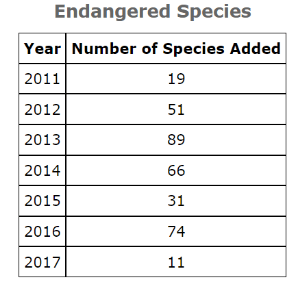
The table shows the number of species added to the US endangered species list each year for several years. What is the correlation that best describes the association between the number of species added to the list and the year? Is it strong or weak?
-.09, weak
400
Correlation or causation:
The older you are, the taller you are
Correlation (some of you are taller than me or your parents)
500
write an equation for the situation:
Frank starts his weight loss journey at 350 pounds and loses 7.5 pounds every week.
Y= -7.5x + 350
or
y= 350 - 7.5x
500
Juan wants to rent a house. He gathers data on many similar houses. The distance from the center of the city, x, and the monthly rent for each house, y, are shown in the scatter plot. Juan models the data on a scatter plot. Create an equation from his graph.
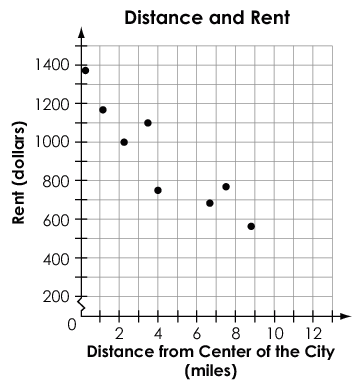
y = .8x + 1275
500
The height (y) of a ball at (x) seconds after it was hit off a tee at an initial velocity of 60 feet per second.
quadratic
500
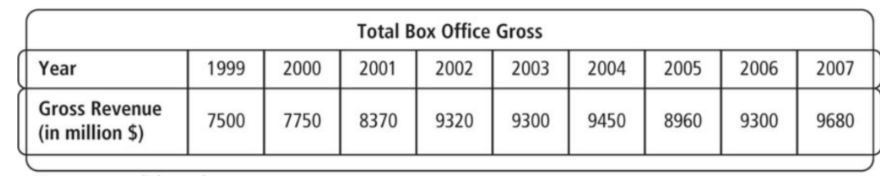 According to the table above, what is the correlation coefficient?
.85
500
Each data point on the scatter plot represents last month’s necklace and earring sales, in thousands of dollars, at one location in a nationwide jewelry store chain. The correlation coefficient between necklace sales and earring sales is 0.98. Wes says that an increase in necklace sales must cause an increase in earring sales. Ann says that an increase in earring sales must cause an increase in necklace sales. Who is correct?
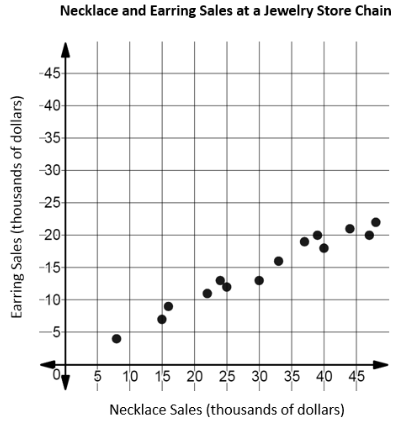
neither Wes nor Ann