Mean, Median, Mode, & Range
Mean Absolute Deviation (M.A.D.)
Dot Plot & Histogram
Box and Whisker Plot
Mixed Review!
100
Find the median:
10 3 9 2 4 3 7 5
4.5 (4+5 = 9/2 = 4.5)
100
What is M.A.D.?
M.A.D. stands for Mean Absolute Deviation. It is the average distance of your data from the mean.
100
The following dot plot shows the number of hours 15 people exercised per week.
What is the greatest number of hours someone exercised?

9
100
What do the ends of the whiskers in a box plot tell you?
The minimum and maximum values
100
What is an outlier?
a number that is far from the rest of the data
200
Find the median:
8 3 9 2 4 3 7 5 8
order: 2 3 3 4 5 7 8 8 9
median: 5
200
Explain the steps to finding the Mean Absolute Deviation.
1. Calculate the mean.
2. Find the distance of all your data points to the mean.
3. Add up all the distances.
4. Divide by the total amount of numbers you have.
200
There is a cluster between ____ and ____
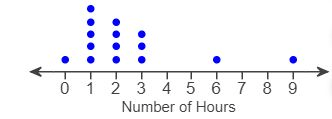
0 and 3
200
What percent does each section in a box plot represent?
25%
200
If Set One has a MAD of 3 and the Set Two has a MAD of 5, Which set has the most variability in their data?
Set Two.
300
Find the mode:
8 3 9 2 4 3 7 5
3 is repeated twice
300
Find the Mean Absolute Deviation. 1, 2, 2, 2, 4, 4, 4, 5
1.25
300
The following histogram shows the ages of library visitors.
About how many people are less than 30?
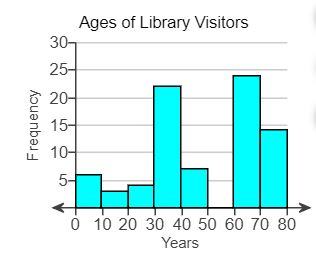
About 12-14
300
The bottom 25% types between ____ and ____ words per minute.
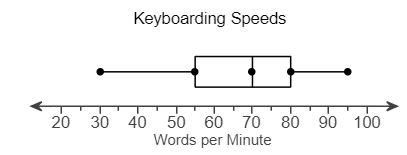
30 and 55
300
The wind speeds during a storm were recorded in miles per hour:
12, 18, 7, 15, 20, 34, 16
Identify any outliers in the data set.
34
400
Find the range: 8 3 9 2 4 3 7 5
9-2=7
400
Find the Mean Absolute Deviation. 61, 61, 61, 61, 61, 61, 61, 61
0
400
About how many people drive more than 30 KM to work?
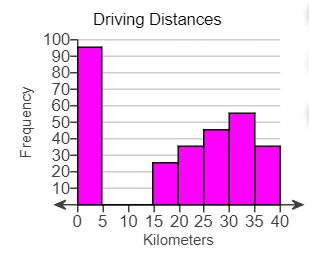
About 90
400
Make a box and whisker plot using these numbers-9,17,21,26,1,0,0,4,35
Label min, max, Q1, median, & Q3. Find the IQR.
TEACHER HAS ANSWER
400
Is it a statistical question? How many students in each class play basketball?
yes. each class can give a different answer
500
Find the mean:
0 4 3 8 6 4 7 2 4 5
4.3
500
Find the Mean Absolute Deviation. Round your answer to the nearest tenth. 103, 171, 115, 165, 124, 170, 125
25.4
500
How many people exercised less than 3 hours?
10
500
Make a box and whisker plot of the data-38,42,50,65,82,91,88,40,34,41,71,93,87,94
Label min, max, Q1, median, & Q3. Find the IQR.
TEACHER HAS ANSWER
500
Based on this box and whisker, what is the upper and lower limits to determine outliers. 
5 and 32