Vocabulary
Populations and Samples
Analyzing Data
Comparing Populations
Miscellaneous
100
What is another word for mean?
Average
100
What is the population of the following two options:
A) Texas
B) America
America
100
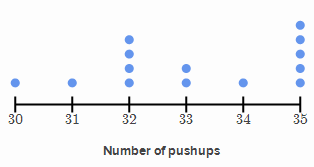
Tristan says the mode is 5. Is he correct? Why or why not?
No, the mode is 35.
100
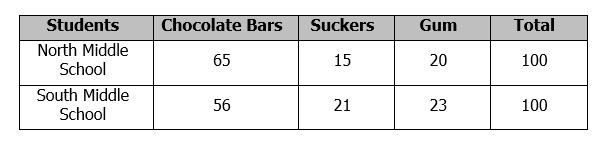
Which school should buy more suckers?
South Middle School
100
What number should you think of when you see the word percent?
100
200
What does biased mean?
Unfairly prejudiced for or against someone or something.
200
Is this a biased or random question:
Isn't green your favorite color?
Biased.
10 Bonus points: What's the random version of this question?
200
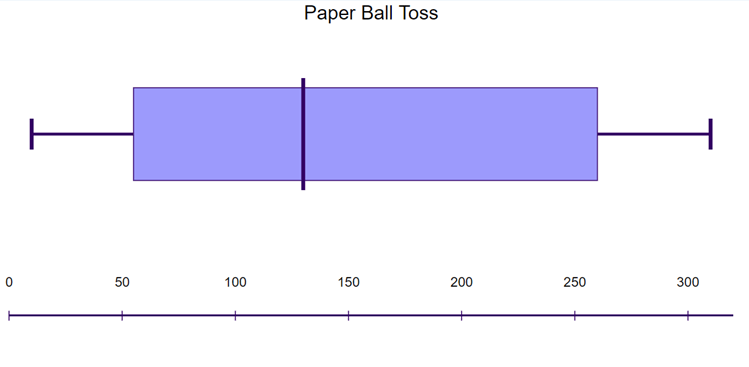
What is the best estimate for the center of this box plot?
Anywhere from 100-150. Probably a little closer to 150.
200
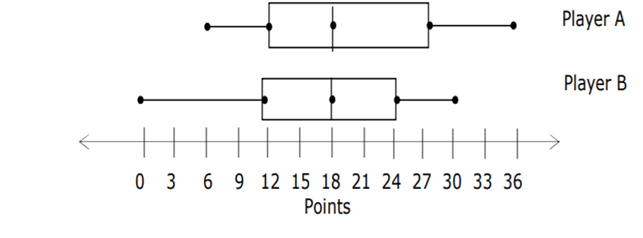
Which is supported by the data in the table?
A) Player A has a larger center than Player B
B) Player A is a better basketball player than Player B
C) Player A had at least one higher scoring game than Player B.
D
200
Where is the median on a box plot?
In the box (or some form of this)
300
When you see "spread", you think....
...RANGE!
300
Is this a random or biased sample?
Going to Walmart and asking how many people have pets.
Random
300
How do I find the interquartile range on a box plot?
Subtract the ends of the boxes.
300
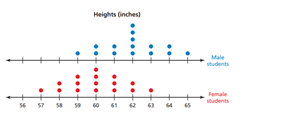
Who has a higher center height? Why?
Boys. Their center height is 62, girls only have a center height of 60.
300
What is the point of a box plot?
To see a lot of data very quickly.
400
When you see "center", you think...
....MEDIAN!!!
400
Give me an example of a population and a sample that is not Texas and a city in Texas.
Lots of different answers.
400
If 12 out of 100 seventh graders hate pizza, how many seventh graders would hate pizza out of 300?
36
400
One of these classes has a 3 certified geniuses in it. Which class most likely has this student?
Class 2. The scores are generally better.
400
When do I use proportions?
When comparing two sets of things, making predictions, and/or finding percent.
500
When you see "most common", you think...
...MODE!!!!
500
Is this a biased or random sample?
Asking students walking out of band what the best elective is.
Biased
20 Bonus points if you can give me the random version of this sample.
500
In a survey, 3 out of 25 students said that they like raisins. If there are 200 students in the school, how many can we expect not to like raisins?
176
500
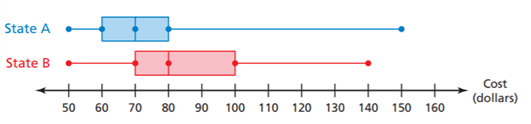
This box plot shows the cost of speeding tickets in 2 states. Julia got a $90 speeding ticket. Which state did she most likely get this ticket in? Why?
State B. The costs are generally higher. They have a mean of 80. Most of the data is between 70 and 100 in State B.
500
What are the five points on a box plots? 20 bonus points if you name them in order from left to right!
1) Least
2) Median of the first half
3) Median
4) Median of the second half
5) Greatest