Calculating Measures Using Random Samples
Definitions
Interpreting Data
Mixed Review
100
Calculate the mean of the set
- Set 1: 4, 10, 2, 8, 10
Mean: 6.8
100
What is a parameter
A parameter is used to describe a population
100
How do you find the range of a data set?
Largest value--smallest value
100
Explain how to create a random sample of 7th graders to determine whether they have a calculator
Assign them each a number, use a random number generator to create your sample and ask those students the question.
200
Calculate the mean
Set 1: 24, 21, 24, 30, 26, 59, 33, 83, 94, 11
Mean 40.5
200
What is the difference between a population and a sample
A population represents the entire group for the study. A sample represents a portion of that group.
200
The mean age of 9th graders at the end of the school year is 14.7. Out of a sample of 12 9th graders, the mean age is 14.9. Calculate the percent error
14.9-14.7/14.7 x 100
1.3% percent error. The students in that sample are 1.3% percent older than the mean age of 9th graders.
200
Suppose Clark is going to take a sample of students and ask whether they prefer popcorn or chips. He will use ten 7th graders that have black hair as the sample. Is this random?
No, not every 7th graders has an equal chance of being selected.
300
Find the mean for 1st period and 4th period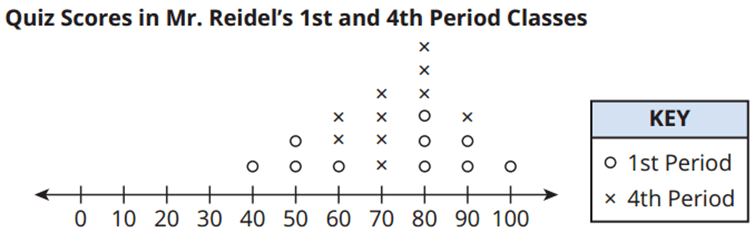
1st period: mean = 72
4th period: mean = 73
300
What is the interquartile range?
Q3-Q1
300
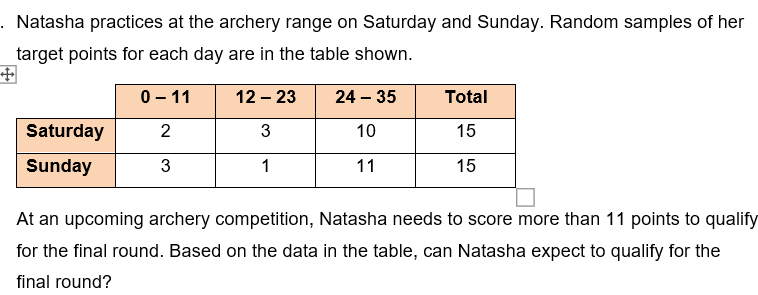
Yes. 25/30 She has an 83% chance of scoring more than 11 points.
300
Based on the table, what percent of student's prefer chocolate?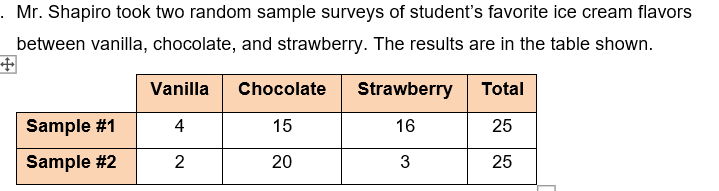
35/50
70% of the students prefer chocolate.
400
What is the median of each box and whisker plot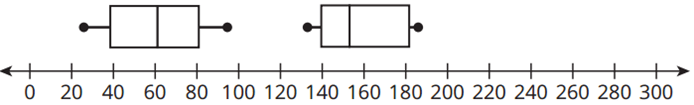
Median of the 1st: 60
Median of 2nd: 151-154
400
Define Median
Define Q1
Define Q3
Median: list numbers from least to greatest--middle number of the group
Q1-median of the lower half of the list
Q3-median of the upper half of the list
400
Describe the overlap of the data sets.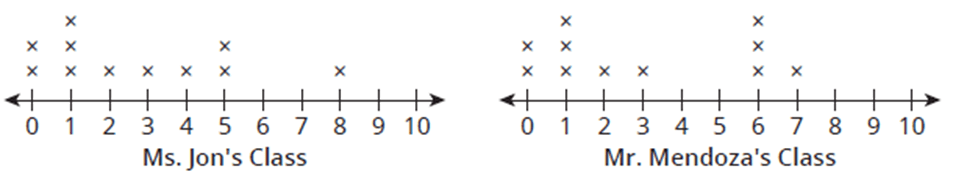
The plots show that two students in Mr. Mendoza's class and two students in Ms. Jon's class each read 0 books, three students in Mr. Mendoza's class and three students in Ms. Jon's class each read 2 books, and one student in Mr. Mendoza's class and one student in
Ms. Jon's class each read 1 book or 3 books.
400
Find the mean, median, and MAD for each data set.
Math Major
Mean: 46.5
Median: 50
MAD: 29.5
Music Major
Mean: 30
Median: 20
MAD: 23
500
Find the mean and MAD of both flavors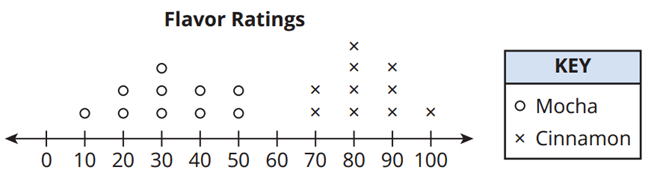
Mocha: mean = 32
MAD = 10.4
Cinnamon: mean = 83
MAD = 7.6
500
What can you find with the five number summary?
Median
Q1
Q3
Minimum
Maximum
500
Find the median and interquartile range of each box and whisker plot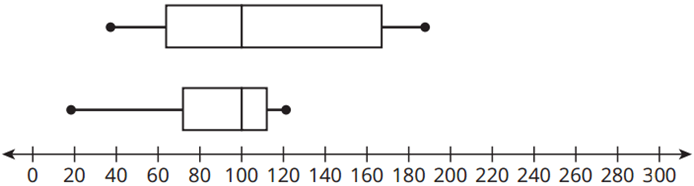
Top plot: median = 100
IQR = 110
Bottom plot: median = 100
IQR = 40
The median of each plot is the same.
The IQR of the top plot is greater than the IQR of the bottom plot
500
Find the five number summary of this table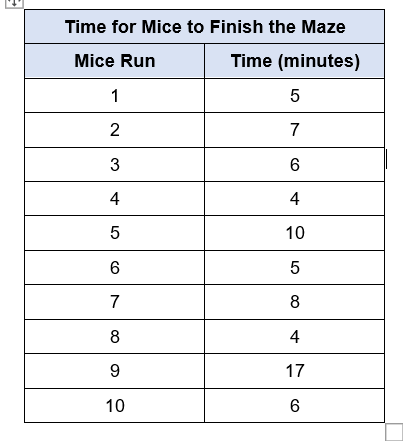
Min: 4
Max:17
Q1:4.5
Q3:9
Median: 6