Vocabulary
MMMR
IQR
Mystery
100
The number of times an item, number, or event occurs in a set of data.
Frequency
100
Find the mean, median, mode, and range of the following data set:
(2, 1, 4, 6, 6, 8, 2, 1, 3, 2, 0)
Round to the nearest whole number.
Mean = 3
Median = 2
Mode = 2
Range = 8
100
What is the IQR?
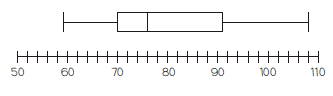
IQR = Q3-Q1
IQR = 91-70
IQR = 21
100
Determine whether the following questions are statistical:
1) Who is my favorite basketball player?
2) What is the favorite subject of sixth graders?
3) How many brothers does my best friend have?
1) Not statistical
2) Statistical
3) Not statistical
200
A way of displaying numeric data using horizontal and vertical bars so that the height or length of the bars indicates frequency.
Histogram
200
Find the mean, median, mode, and range of the following data set:
(5.23, 5.15, 5.27, 8.21, 6.38, 2.95, 8.21, 3.23)
Mean = 5.58
Median = 5.25
Mode = 8.21
Range = 5.26
200
Below is a list of salaries earned by 10 employees at Clinch County Middle School. Find the IQR of the 10 salaries.
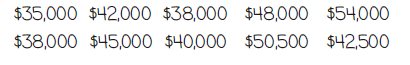
Q1 = 38,000
Q3 = 48,000
IQR = 48,000 - 38,000
IQR = $10,000
200
What is the median of the date set in the box and whisker plot?
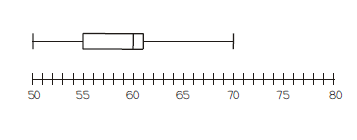
Median = 60
300
A measure of spread for a set of data. To calculate this term, you must subtract the smallest value from the largest value.
Range
300
Find the mean, median, mode, and range of the following data set:
(125, 136, 189, 136, 212, 218, 152, 175, 125)
Mean = 163
Median = 152
Mode = 125 & 136
Range = 93
300
Examine the high temperature from last week and find the IQR.
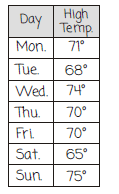
Q1 = 68
Q3 = 74
IQR = Q3 - Q1
IQR = 74 - 68
IQR = 6
300
What is the third quartile of the following box and whisker plot?
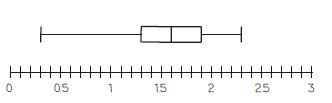
Q3 = 1.9
400
The difference between the first and third quartiles.
Interquartile Range
400
Find the mean, median, mode, and range of the following data set:
(2.89, 2.38, 6.38, 2.15, 4.13, 4.32, 3.89, 3.35, 2.38)
Round to the nearest thousandth.
Mean = 3.54
Median = 3.35
Mode = 2.38
Range = 4.23
400
What is Q1, Q3, and IQR?
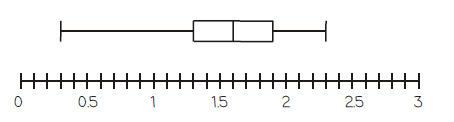
Q1 = 1.3
Q3 = 1.9
IQR = Q3-Q1
IQR = 1.9 - 1.3
IQR = 0.6
400
What is the range of the data set of the box and whisker plot?
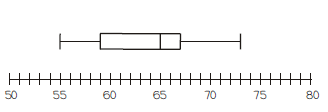
Range = 73 - 55
Range = 18
500
Describes how spread out or closely clustered a set of data is.
Variability
500
Find the mean, median, mode, and range of the following data set:
(2.5, 3.1, 3.7, 2.9, 4.5, 8.1, 2.1)
Mean = 3.84
Median = 3.1
Mode = No Mode
Range = 6
500
What is the IQR of the date set below?
(2.5, 5.2, 5.2, 4.5, 4.4, 8.2, 6.5, 5.3, 8.4)
Q1 = 4.45
Q3 = 7.35
IQR = Q3 - Q1
IQR = 7.35 - 4.45
IQR = 2.9
500
What do we need to comment on the distribution of data? What does each letter represent?
What is CSOC OR SOCS