Quantitative Data
Qualitative Data
Data Basics
Normal Distributions
Grab Bag (mix of topics!)
100
This way of visualizing data includes a labeled horizontal axis, a rectangle with a vertical line through it, and two horizontal lines extending from the middle of the rectangle.
What is a Box (and Whisker) Plot
100
This variable is given across the top of the two way table
What is Feelings About Skateboards (or similar)?
100
This variable describes data that is non-numerical.
What is a categorical variable?
100
This is the shape of a Normal Distribution.
What is Bell-Shaped?
100
The acronym (and what it stands for) to help describe data distributions is
What is CUSS?
Center, Unusual Features, Shape, and Spread
200
 What is the shape of the data distribution shown below?
What is skewed to the left?
200
The fraction of people that like skateboards, given that they also like snowmobiles, is.
What is 80/125?
200
This type of number is considered a categorical variable, not quantitative.
Multiple answers accepted!
What is a zip code (or phone number)
200
This is the amount of data within 2 standard deviations from the mean on a normal distribution.
What is 95%?
200
This is what a calculation made from data is called.
What is a statistic?
300
The mean of the data shown on the dot plot is 
What is 2?
300
The marginal distribution of the variable "Feelings about Snowmobiles" is
What is Likes Snowmobiles: 105/160, Do not like Snowmobiles: 55/160
300
This question about collecting data helps you determine the purpose of a study.
What is "why"
300
This is what a z-score of -0.5 means.
What is a data point 0.5 standard deviations below the mean?
300
This is what N(1020, 60) means.
What is a normal distribution with mean 1020 and standard deviation 60?
400
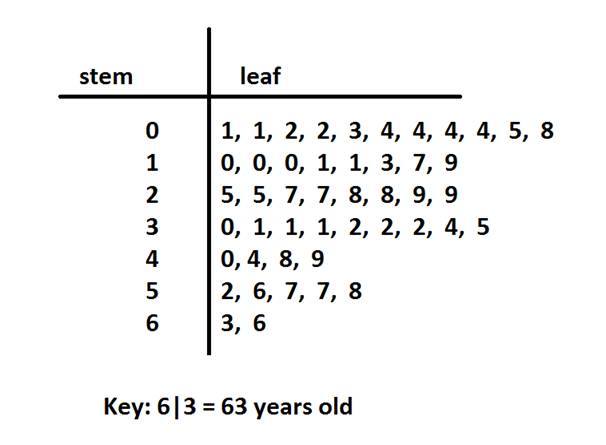
The median of the distribution shown in the data below is
What is Between 30 and 40?
400
The marginal distribution of the variable Feelings About Skateboards is
What is Likes skateboards: 125/160, Do Not Like Skateboards: 35/160
400
This article collected data on what categorical variables?
"In November 2003, Discover Magazine published an article on the colonies of ants. It reported some basic information about many species of ants and the results of some discoveries found by a professor named Walter Tschinkel from the University of Florida.
Information presented in the article included: the scientific name of the ant species, geographic location, the depth of the nest (in feet), the number of chambers in the nest, and the number of ants in the colony."
What is the scientific name of the ant species and geographic location?
400
This is the standard deviation for the dataset 0, 4, 5, 6, 10.
What is 3.6?
400
This is what two variables are called if the values of their conditional distributions are within 1% of each other.
What is independent?
500
The 5 number summary of the data below is
What is Minimum: 12, Q1: 13, Median: 18, Q3: 22, Maximum: 25
500
The conditional distribution of the variable Feelings About Snowmobiles, given that someone likes Skateboards is:
What is Like Snowmobiles: 80/125, Do Not Like Snowmobiles: 45/125
500
This is the reason why this data was being collected:
"Business analysts hoping to provide information helpful to American grape growers compiled these data about vineyards: size (acres), number of years in existence, state, varieties of graphs grown, average case price, gross sales, and percent profit."
What is providing helpful information to American grape growers?
500
This is the percent of data under the normal curve N(10, 2) between the values 8 and 14.
What is 81.5%?
500
This is what a bimodal distribution with a median of 20 and an outlier at 52 looks like.
You must draw this!
What is _____?
Ms. Robb will draw it for you!