Scientific Method
Charts and Graphs
Science Disciplines
Key Terms
Final Jeopardy
100
First step in the scientific method.
Generate a question based on an observation.
100
Why are charts and graphs used to display results of an experiment?
Easier to visualize trends/relationships between two variables.
100
Name for someone who studies life.
Biologist
100
Parts of an experiment that are kept the same for all the test groups.
Constants.
200
Second step in the scientific method.
Research the topic to learn as much as is already known on the subject.
200
Name of graph/chart used to show percentages.
Pie chart
200
Name for someone who studies rocks.
Geologist
200
What does repetition mean in a scientific study?
When a trial is done again (repeated) more than once by the same person.
300
What is the third step in scientific method.
Form a hypothesis then design an experiment or if field work gather data through observation.
300
Name for someone who studies the weather and climate.
Meteorologist.
300
The variable that is changed by the scientist.
Independent/test variable.
400
What is the fourth step in scientific method?
Analyze the empirical data/evidence.
400
Name for someone who studies chemicals and reactions.
Chemist
400
The variable in an experiment that is measured. Might change because another variable is changed.
Dependent/outcome variable.
500
And lastly, after analyzing the data what does a scientist do next?
Determine whether hypothesis correct or not/draw conclusions. Publish findings to scientific community. Results may create more questions that can be studied.
500
Name for someone who studies fossils.
Paleontologist
500
Information/data that is acquired by observation or experimentation and is used to prove or disprove a hypothesis.
Empirical Evidence
500
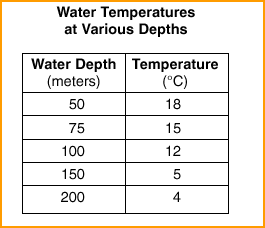
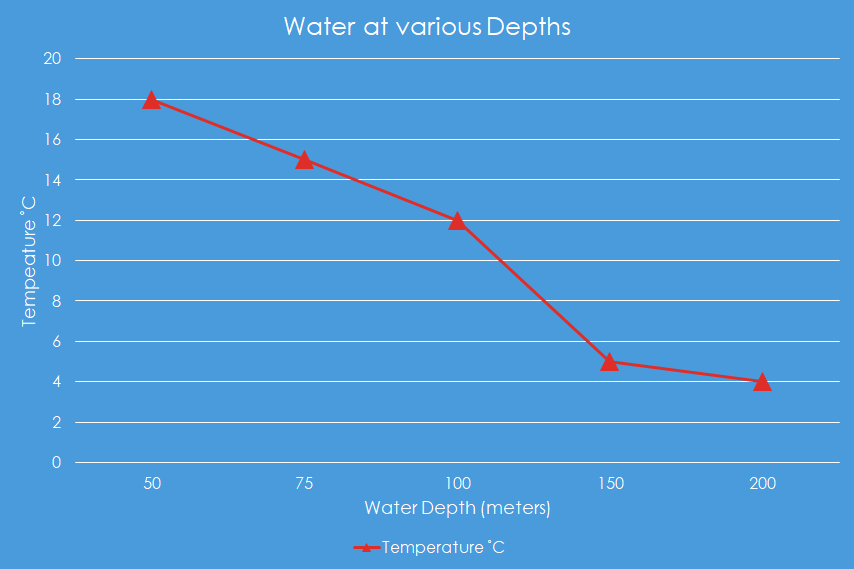
Draw the best graph for the following data: