Tracked Terrain Tactics
Extreme Nav Know-How
Beaufort Wind Force Scale
Weather Maps and Charts
More Weather and stuff
100
What is a ‘handrail’ in navigation?
A linear feature used to follow a path
100
What does ‘resection’ mean in navigation?
Locating your position by using bearings to three known features
100
What is the name and wind speed range of Beaufort Force 3?
It’s called a Gentle Breeze, with wind speeds of 12–19 km/h.
100
What do mean sea level pressure analysis charts show?
They show air pressure at sea level and weather conditions at a specific moment in time.
100
What does a cyclone represent on a weather map, and where do they typically form?
A cyclone is a low-pressure system that forms over warm tropical waters, usually when the sea surface temperature is above 26.5°C.
200
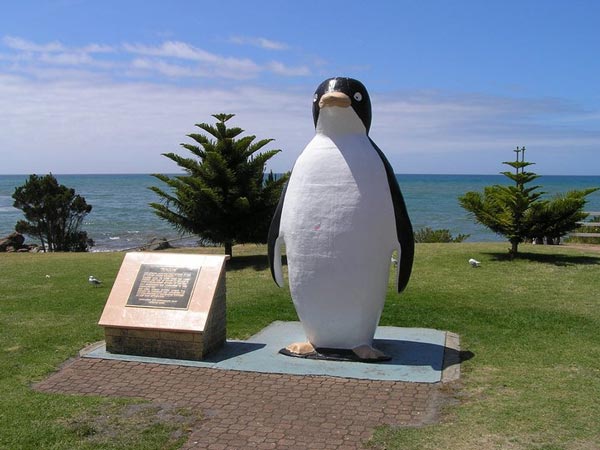
In what Australian town would you find the big penguin?
Penguin
200
Name one strategy for navigating in dense forest or low visibility.
Use pacing, compass bearings, or prominent features
200
Where in Australia would you find the Big Bullock?
Rockhampton.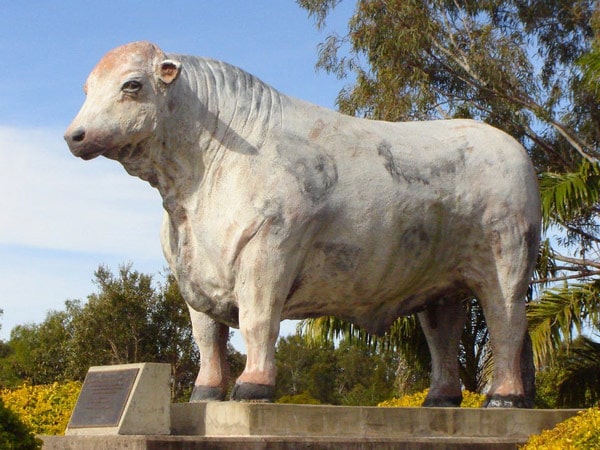
200
What is the purpose of synoptic and forecast charts?
What is the purpose of synoptic and forecast charts?
200
How can you distinguish an anticyclone from a cyclone on a weather map, and what kind of weather is typically associated with it?
An anticyclone is a high-pressure system that rotates anti-clockwise in the Southern Hemisphere and is associated with fine, settled weather and lighter winds.
300
When navigating a track, what should you do if you reach an unexpected junction?
Stop, check map & surroundings, confirm your location
300
What are 3 key risks when navigating in untracked, steep terrain?
Falls, getting lost, or poor visibility
300
What is the name and wind speed range of Beaufort Force 6?
It’s called a Strong Breeze, with wind speeds of 38–49 km/h.
300
What are isobars and what can they tell you about wind?
Isobars are lines connecting points of equal air pressure; closely spaced isobars indicate stronger winds.
300
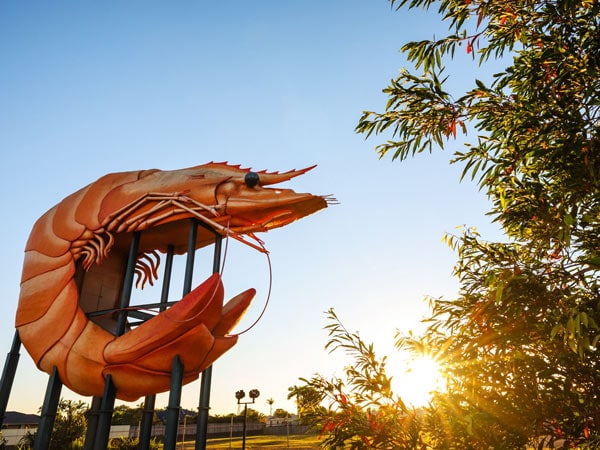
In what town would you find the big prawn?
Ballina.
400
What are ‘catching features’ and how do they help?
Features that indicate you’ve gone too far, like a road or creek
400
How does ‘aiming off’ help when navigating to a linear feature?
It deliberately offsets your bearing so you know which direction to turn
400
Describe the conditions you might see on land during Beaufort Force 6 winds.
Large branches move, whistling is heard in telegraph wires, and umbrellas are used with difficulty.
400
What is the difference between a cyclone and an anticyclone in weather maps?
A cyclone is a low-pressure system linked with storms and bad weather; an anticyclone is a high-pressure system associated with calm, settled weather.
400
What is the difference between a trough and a ridge on a weather map, and how are they represented?
A trough is an elongated area of low pressure shown as a dashed blue line, often separating moist and dry air. A ridge is a high-pressure extension seen in the mid-latitudes, representing settled weather conditions.
500
Describe how to use a compass bearing to follow a track accurately.
Set the bearing, align compass needle, walk keeping needle in orienting arrow
500
Describe 4 strategies you’d use to safely plan a route through a heavily vegetated and steep area.
Identify safe terrain, use contour lines to avoid cliffs, check weather, use attack points
500
What is Beaufort Force 10, what are its wind speeds, and what kind of damage can it cause?
Beaufort Force 10 is a Storm, with wind speeds of 89–102 km/h. It can uproot trees and cause considerable structural damage.
500
What is a front, and why is it important in weather forecasting?
A front is the boundary between two air masses of different temperature and humidity. It often causes significant weather changes like rain, snow, or strong winds.
500
How are precipitation intensity, cloud cover, and temperature represented in station models on weather maps?
Precipitation intensity is shown in mm or inches per hour; cloud cover is symbolised using shaded circles; and temperature is shown as two numbers — maximum and minimum — near the station symbol.