Percentile
Z-Score
The Empirical Rule
Review of One Variable Data
Review of Data Collection
100
You are told that your score on an exam is at the 85th percentile of the distribution of scores. This means that...
Your score was equal to or higher than approximately 85% of the people who took this exam.
100
The mean is 80 and the standard deviation is 10. What is the standard score (z-score) for an observation of 90?
1.0
100
For a Normal distribution with mean 20 and standard deviation 5, approximately what percent of the observations will be between 5 and 35?
99.7%
100
On a dotplot, the closer the dots the more _____ the data is
consistent
100
A sample in which every element in the population has an equal chance of being selected is a
random sample
200
Here is a list of exam scores for Mr. William's calculus class:
60 61 61 65 72 75 75 78 81 81 85 89 91 98
What is the percentile of the person whose score was 85?
79%
200
Samir earned an 88 on a test for which the class mean was 78 and the standard deviation was 8. Samir's standardized score (z-score) was...
1.25
200
For a Normal distribution with mean 20 and standard deviation 5, approximately what percent of the observations will be less then 20?
50%
200
Ms. Miller collected data from her students on how many states they have visited. The data is shown in the dotplot below. Interpret the median of 6 in context.

Half of the students have been to less than 6 states, and the other half have been to more than 6 states.
200
A country radio station wants to know what the most popular type of music is, so they ask their listeners to call in to say their favorite type. Is this sample random, why or why not?
No because people are volunteering to answer and they all listen to the same country radio station.
300
Here is a list of exam scores for Mr. William's calculus class:
60 61 61 65 72 75 75 78 81 81 85 89 91 98
What is the percentile of the person whose score was 75?
50%
300
The mean height of African-American men is 69.5 inches and the standard deviation is 2 inches. President Barack Obama is 73.5 inches tall. The standard score (z-score) for his height is...
2
300
For a Normal distribution with mean 20 and standard deviation 5, approximately what percent of the observations will be less than 10?
2.5%
300
Who scored less points on average?

Sam
300
True or False: I have asked 10 people the size of the shoes they wear. My results are 6, 6 1/2, 8, 9, 10 1/2, 7 1/2, 8, 6 1/2. This is continuous data as the values are not whole numbers.
False. This is discrete data.
400
What is the definition of percentile?
The percent of observations that are equal to or lower than a particular observation.
400
The distribution of heights of adult of adult men is approximately Normal with mean 69 inches and standard deviation 2.5 inches. How tall is a man whose standardized height is -0.3?
68.25
400
The distribution of heights of adult men is approximately Normal with mean 69 inches and standard deviation 2.5 inches. What percent of all men are between 66.5 and 71.5 inches tall?
68%
400
What is the IQR in the box plot?
5
400
A researcher observes and measures characteristics of interest of part of a population but does NOT change existing conditions.
observational study
500
What does it mean if you scored within the 25th percentile on a test?
You scored the same or better than 25% of people who took the test.
500
What is the equation for z-score?
z=(x-mean)/standard deviation
500
What percent of observations fall within 3 standard deviations of the mean?
99.7%
500
Which dataset has a higher standard deviation?
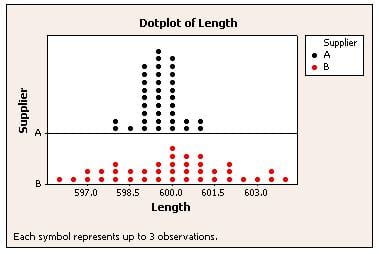
Supplier B because the dataset is more spread from the center.
500
A harmless, unmedicated treatment, that is made to look like the real treatment.
placebo