Central Tendencies & Dot Plots
Histograms/Frequency Plots
Box and Whisker
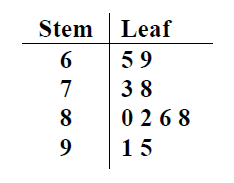
Stem and Leaf
Circle/Bar Graphs
100
What is the median?
1, 7, 7, 7, 3, 2, 5, 3, 4
Median = 4
100
How many students are represented in this histogram?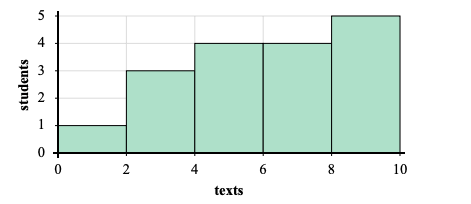
17 students
100
What are the two equations to find outliers?
Lower Fence Q1 - 1.5(IQR)
Upper Fence Q3 + 1.5(IQR)
100
Find the mode
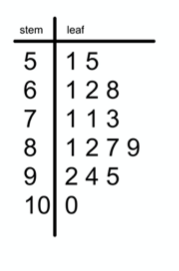
71
100
Which activity is the least popular?
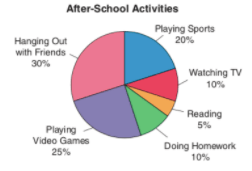
Reading
200
What is the range?
1, 7, 1, 9, 10, 4, 9, 8, 6, 9
Range = 9
200
How many bags between 60-79 pieces?
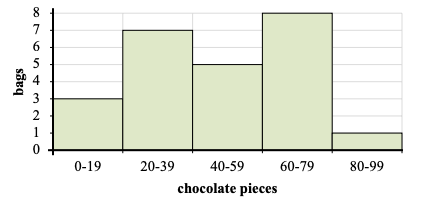
8 bags
200
How do you find Interquartile Range (IQR)?
Q3 - Q1
200
Find the range
30
200
How many students thought they watched too much tv if there are a total of 120 students?
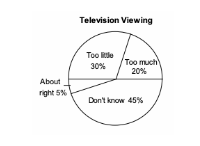
24 students
300
How do you find the median of a set of a data if there are two numbers in the middle?
Add both numbers up and divide by two (average)
300
What is the range of gas in gallons?
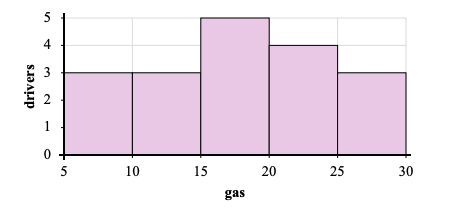
25 gallons
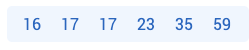
300
What is the lower quartile?
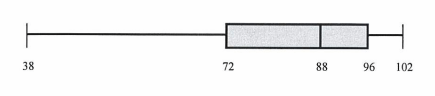
72
300
What is the largest number of floors?
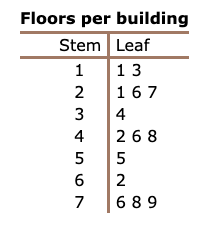
79 floors
300
What two sports combined did 50% of the people choose?
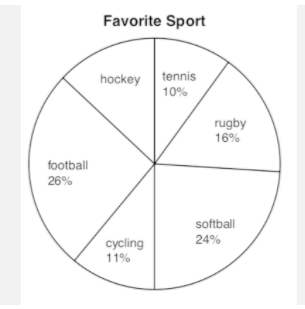
Football and softball
400
Find the mean
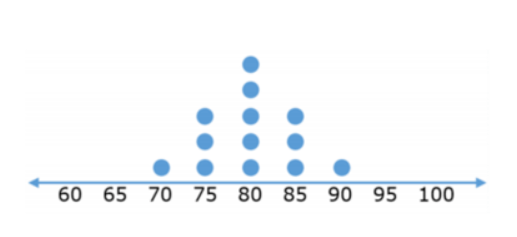
Mean = 80
400
How many students took less than 40 minutes to get ready? 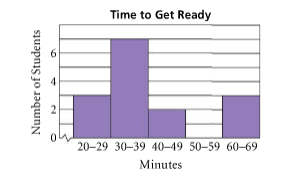
10 students
400
Find IQR
18
400
How many trains had exactly 51 passengers?
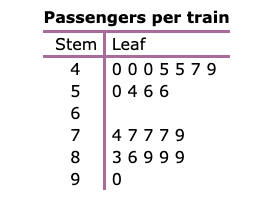
0
400
If there are 200 vegetables, how many cucumbers are there? 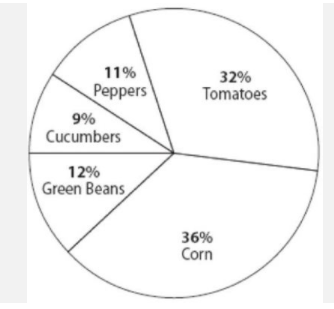
18 cucumbers
500
How many boys had a pulse greater than 82?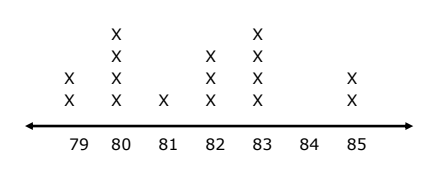
6
500
How many students received less than 4 gifts or more than 7 gifts?
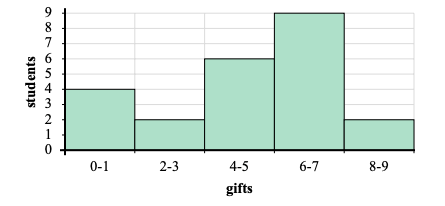
8 students
500
12, 19, 19, 20, 21, 22, 22, 23, 24, 26, 27, 28, 29, 30, 32, 35, 40, 44
Which of the numbers above is the outlier?
44
500
How many movies had at least 50 actors?
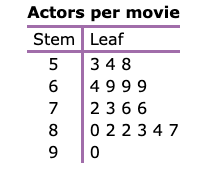
18 movies
500
How many people live in Alberta and Saskatchewan if there are 2,500,000 people total in the Western Provinces? 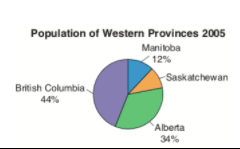
1,100,000 people