Dot Plots and Box Plots
Histograms
Measures of Center
IQR
Extreme Values
100
Dot Plots show __(how many?)_ piece of data.
Every
100
Histograms show a ____ of numbers, vs showing every single value.
Range
100
How do you find the Mean of a Data Set?
Add all of the numbers and divide by how many they are.
100
What does IQR stand for?
Interquartile Range
100
If the data is symmetric, then the mean and median are
The same
200
What is the 5-number summary?
Minimum, First Quartile, Median, Third Quartile, Maximum
200
What is frequency?
The amount of times something happens / how often something occurs.
200
Find the Mean in the Data Set: 3, 4, 7, 9, 5, 2
What is 5
200
How do you find the IQR?
Q3 - Q1
Median of upper quartile - median of lower quartile
200
If the data is skewed right, then the mean is _____ than the median
greater
300
How much % of the data is in 1 quartile?
25%
300
Do histograms show the median of a set of data?
No
300
How do you calculate the median?
Arrange numbers from smallest to largest, then find the middle number.
300
Find the IQR of the Data Set:
1, 5, 7, 9, 10, 12, 14
What is 7?
300
If the data is skewed left, then the mean is _____ than the median
less
400
If I wanted to find the mean, would I use a dot plot or a box plot?
dot plot
400
Why would we choose to use a histogram over a dot plot or box plot?
To see the frequency of data across ranges.
400
What is the mode?
The number that appears the most often.
400
Find the IQR of the Data Set below
3, 9, 11, 0, 4, 10, 8, 1
What is 7.5?
400
By adding the values 2 and 3 to the data, what would happen to the mean?
4, 5, 10, 15, 16
It would move to the left/get smaller
500
If I wanted to find the median quickly, would I use a dot plot or a box plot?
Box plot
500
How would you describe the shape of this distribution?
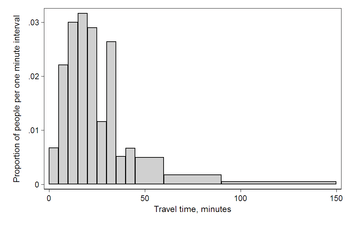
Skewed right.
500
How do you find the first and third quartile?
Find the medians of the upper and lower half.
500
Who has the greater IQR and by how much?
A: 6, 5, 8, 10, 3, 7, 2
B: 9, 1, 3, 8, 6, 10, 8
Group B by 1
500
By adding the values 3 and 17 to the data, what would happen to the mean?
4, 5, 10, 15, 16
It would still be 10/ wouldn't change