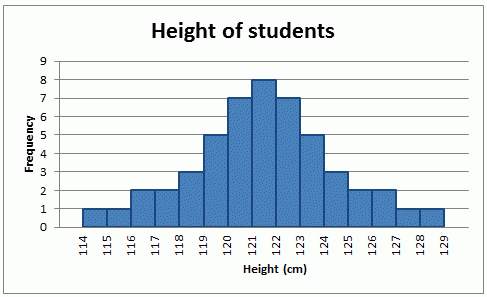
What is the shape of this distribution?
Time: One Minute
What is bell-shaped distribution?
The two measures of center are:
Time: One Minute
What is median and mean?
The one that doesn't belong is:
Interquartile Range
Standard Deviation
Mean Absolute Deviation
Mode
Time: One minute
What is mode?
True or false: every minimum value is also an outlier
Time: One minute
What is false?
Mikaela's fantasy soccer team has a standard deviation of 3.7 goals. Jeisi's team has a standard deviation of 2 goals. Whose team has more variability?
Time: One Minute
What is Mikaela?
Is this skewed right or skewed left?
Time: One minute
What is skewed left?
Find the mean
72 75 81 76 76 77 79 78
Do NOT round answer
Time: Two minutes
What is 76.75?
We use this when the data is symmetric
Time: One Minute
What is standard deviation?
We know that ___ is an outlier because it is greater than ___.
3 3 4 4 5 5 2 1 12
Time: Four minutes
What is we know that 12 is an outlier because it is greater than 8.75?

Whose class has a greater measure of variability?
Time: One minute
What is Calgary's class?
True or false: all uniform distributions are also symmetric
Time: One Minute
What is true?
Find the median
72 75 81 76 76 77 79 78
Time: Two Minutes
What is 76.5?
The standard deviation is:
101 102 105 105.4 106 107 99.5
Round answer to TWO decimal places
Time: Two minutes
What is 2.63?
We know that ___ is an outlier because it is less than ____.
12 12 11 13 14 15 10 20 4
Time: Four minutes
What is we know that 4 is an outlier because it is less than 4.5?

Which measure of center should we use to compare these histograms?
Time: One minute
What is mean?
True or false: all bimodal data sets are symmetric.
Time: One Minute
What is false?
We use this measure of center when the data is NOT symmetric.
Time: One Minute
What is median?
This measure of variability is the LEAST affected by outliers.
Time: One minute
What is Interquartile Range?
True or false: outliers should always be removed from data sets.
Time: One minute
What is false?

Which measure of variability should we use to compare these histograms?
Time: One minute
What is interquartile range?
Draw a dot plot with a TRImodal distribution.
Time: Two Minutes
The best measure of center for this data set is:
100 101 101.5 101.78 102 103 103 99 98 101
Time: One minute
What is mean?
The IQR is:
7 7.5 7.8 9 9 9 15 15 18 10
Time: Three minutes
What is 7.2?
Josue rolled a normal die and wrote down his scores:
1 3 3 3 3 4 4 9 6 6 5.
He decided to remove the 9 from the data set. Was he correct to do so?
Time: One minute
What is yes, Josue was correct?
Create two box plots with equal measures of variability and different measures of center.
Time: Five minutes
