Data and variables
Probability
Comparisons
Null hypotheses
Anything Goes
100
Time for a cuppa!
What is a continuous
100
A drawer contains 20 socks: 8 blue, 4 green, 6 black, and 2 white. What is the probability of picking out a blue sock?
What is variance
What is 2/5
100
A type of test that compares observed values to expected values.
What is the chi square test
100
An assumption made on the basis of limited evidence as a starting point for further investigation.
What is a hypothesis
100
If a distribution of scores are normally distributed, the range is within two standard deviations (true or false)
What is True
200
Colours of my socks
What is nominal
200
A spinner has 6 equal sections, red, blue, yellow, green, orange, and pink. What is the probability that the spinner will land on yellow?
What is 1/6
200
Type of comparison that compares the same people two times (e.g. pre-post test).
What is a paired t-test? (or dependent, related measures, repeated measures t-test)
200
Reject the null hypothesis
What is accept the alternate hypothesis
200
If the median is higher than the mean is the distribution negatively or positively skewed ? More scores of central tendency are in the upper end)
What is negatively skewed?
300
Size of my socks
What is ordinal
300
The probability of flipping a coin heads 3 times in a row.
What is 1/8
300
Test of comparison comparing means of 3 or more groups
What is ANOVA? (one-way)
300
Use the ____ level to determine whether or not to reject or retain the null hypothesis. You test your p-value based on this.
Significance level or alpha level (usually 0.05 or 0.01).
300
Value that describes the goodness of fit of a straight line
What is R2
400
Weight of my socks
What is continuous
400
Monica made the following line plot for the first 20 cars that drove past her school. Each x represents one car.
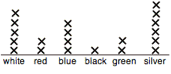
Based on this data, what is the probability as a fraction in simplest form that the next car will be white?
Answer = 1/4
5 white cars out of 20 cars = 5/20 =1/4
400
A type of test that compares the mean you found in your one group to a mean that is already known.
What is one sample t-test?
400
A p-value set at this level means that there is a 95% chance that your findings did not occur at random or come from the "null hypothesis" population.
What is 0.05
400
The square root of the mean of the squared deviations from the mean.
What is standard deviation?
500
Goodness! How many socks?
What is discrete
500
Monica made the following line plot for the first 20 cars that drove past her school. Each x represents one car.
Based on this data, what is the probability as a percent rounded to the nearest whole number that the next car will NOT be green?
Answer is 90%
18/20 = 9/10 = 0.90 X 100 --> 90%
500
Test to test if men actually like chocolate more than women do
What is the Mann-Whitney U-test
(next time!)
500
If you have a p value of 0 from a t-test will you reject the null hypothesis? Why?
Yes
p is less than 0.05 and therefore difference between the two groups is not due to chance, and is significant.
[H0 : There is no significant difference ] is rejected
500
Use this test to determine if one predictor variable predicts a dependent variable.
What is simple linear regression?