Week 1&2
Week 3
Week 3 cont.
Week 4
Week 5
100
"Health is a state of complete _______, ______, and _________ well-being and not merely the absence of _______ or _______"
"Health is a state of complete physical, mental, and social well-being and not merely the absence of disease or infirmity" - WHO
100
The investigator measures fish intake at baseline and periodically examines subjects at follow-up visits to see if those who eat more fish have fewer CHD events
Case-control
Cohort
Cross-sectional
Experimental
observational) cohort
A group followed over time
100
numbers that describe the population
Parameter
100
Calculate the IQR range for the following:
Q1 = 20
Q2 = 80
Q3 = 50
IQR = 30
100
Descriptive Epidemiology organizes and analyzes data in order to understand patterns of health and disease by ______, ________, and _______.
Descriptive Epidemiology organizes and analyzes data in order to understand patterns of health and disease by PERSON, PLACE, and TIME.
200
What are the 3 core functions of Public Health?
Assessment, Policy Development, and Assurance
200
To make generalizations about the entire population based on studying the sample
inference
200
Subjects are interviewed about current and past history of fish intake and correlates results with history of CHD and current coronary calcium score
(observational) cross sectional
A group examined at one point in time
200
What is a robust measure? Give examples
resistant to outliers
median, IQR, mode
200
What is the last step in the public health surveillance process?
Link to Action
Data Collection>Data Analysis> Data Interpretation> Data Dissemination> Link to Action
300
the development, implementation, and evaluation of effective programs and policies in public health through application of principles of scientific reasoning
EBPH
300
An interviewer examines a group of patients with CHD (cases) and compares them with a group who did not have CHD (controls), asking about past fish intake
(observational) case-control
two groups selected based on the presence or absence of an outcome
300
What are the outcome and exposure?:
A study in Nebraska comparing the consumption of caffeine during pregnancy to low birth weight
exposure = caffeine during pregnancy
outcome = lbw
300
What is the relationship between incidence and prevalence?
Incidence = new cases
Prevalence = existing cases
300
In Cameronsville, 40 out of 200 children under 5 years of age passed away in 2015. What is the Under 5 Mortality rate in this scenario?
200
400
What is the first step in the EBPH approach?
Step 1: Defining the problem
Step 2: What “causes” the problem? (exposures)
Step 3: Develop and test community-level interventions to control or prevent the cause of the problem
Step 4: Implement interventions to improve the health of the population (when, who, how model)
Step 5: Monitor those interventions to evaluate their effectiveness (REAIM)
400
What type of data would marital status be?
What type of data would marital status be?
400
Instead of using actual names, subjects included in the National Health and Nutrition Examination Survey are coded with consecutive numbers.
Which level of measurement is most appropriate?
Nominal; the numbers have no intrinsic order
400
What is the notation for the population and sample mean?
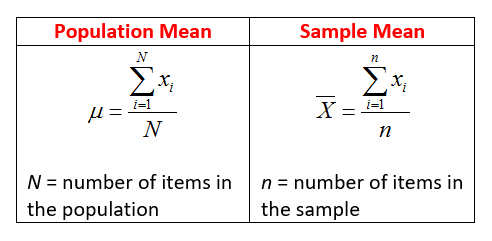
400
The average number of years that a person can expect to live in “full health” by taking into account years lived in less than full health due to disease and/or injury
HALE
500
What is the difference between primary, secondary, and tertiary?
Primary = prior to disease or condition
Secondary = prior to symptoms
Tertiary = prior to irreversible complications
500
What are the outcome and exposure?:
A study in Illinois compared low birth rates in children under 1-year-old to the likelihood of having hypertension later in life.
exposure = lbw
outcome = hypertension
500
What type of data would letter grades be?
Ordinal; natural order
500
For a left skewed histogram, which is larger, the mean or the median?
Left median > mean
Right median < mean
500
for a disease or health condition are calculated as the sum of the Years of Life Lost (YLL) due to premature mortality in the population and the Years Lived with Disability (YLD) for people living with the health condition or its consequences
DALY