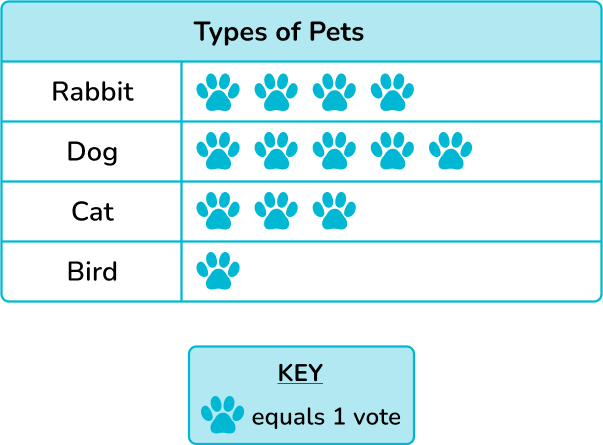
Graph 1
Graph 2
Graph 3
Graph 4
100
Name the type of graph that uses pictures to represent information.
Pictograph
100
A type of graph that uses bars to represent data values.
Bar Graph
100

What is the title of the graph above?
Favourite Colour
100
What type of graph is shown below
Pictograph
200
What does the key on a pictograph represent?
The key tells the value of each picture.
200
True/False. The space between the bars on a bar graph must always be equal.
True.
200
What pet was most popular among the students? 
Dogs
200
How many students liked Dogs more than Fish?
2 students
300
How many students altogether voted for a favorite pet? 
13 students
400
How many apples were sold in March?
25 apples
