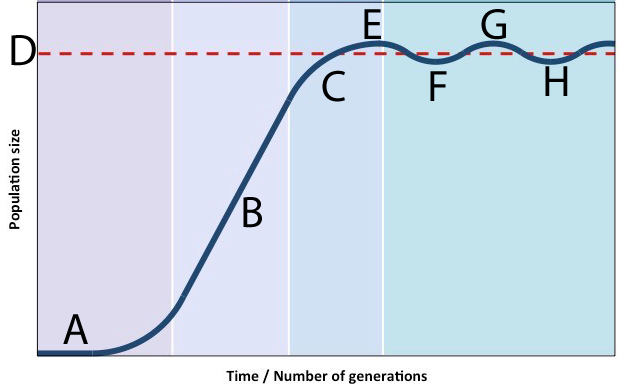
A population that grows quickly, with no limits does not reach this.
What is carrying capacity?
A limiting factor that is not more likely in a large population is called this.
What is a density independent factor?
A "J" curve represents this type of growth.
What is "...exponential growth."
When birth rate is greater than death rate this happens.
What is the population grows?
Point B on this graph shows a population that is doing this.

What is growing?
When on a graph growth resembles a line trending upwards the population is doing this.
What is increasing?
A limiting factor that IS more likely in a large population is called this.
What is a density dependent factor?
A "S" curve represents this type of growth.
What is logistic?
After a natural disaster if many organisms have died the NEXT generation of the population would do this.
What is increase.
Point E on this graph shows a population that is this.

What is above carrying capacity?
When a population graph resembles a "J" shape and population has not reached carrying capacity.
What is exponential growth?
Natural disasters are this type of limiting factor.
What is density independent?
The K in this graph is representative of this limiting factor based cap on a population.

What is carrying capacity?
When death rate is greater than birth rate.
What is the population decreases?
Point F on this graph shows a population that is this.
 Anything that can affect a population.
What is a below carrying capacity?
When a population graph resembles a "S" shape and the population has hit carrying capacity.
What is logistic growth?
Disease is this type of limiting factor.
What is density dependent?
This is the carrying capacity of this population
What is 500?
When the birth rate and death rate are equal.
What is the population is stable?
Point D on this graph shows this.

What is carrying capacity?
This graph is an example of a population experiencing these limiting factors. 
What is no limiting factors?
Suppose in a population of 1000 wild horses, there are 400 births and 220 deaths. Also, 180 new horses join the population from an area that was destroyed by fire, and 380 horses are captured by park rangers. Describe the overall change in this horse population.
What is Because a total of 580 horses are added and a total of 600 horses are lost, the population decreases by 20 individuals.
When the death rate is significantly higher than the birth rate for a long period of time the population may do this.
What is goes extinct?
Point C on this graph shows a population that has reached this.
 The foxes are getting fat on all those rabbits.
What is carrying capacity?