Measures of ...
Normal Distribution
Z-Scores
100
A professor had students keep track of their social interactions for a week. The number of social interactions over the week is shown in the following grouped frequency distribution. How many students had at least 70 social interactions for the week?
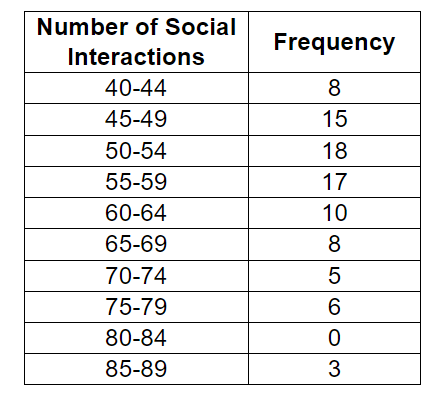
5 + 6 + 0 + 3 = 14
100
The figure illustrates a normal distribution for the prices paid for a particular model of a new car. The mean is $20,000 and the standard deviation is $500.
Use the 68-95-99.7 Rule to find the percentage of buyers who paid between $18,500 and $ 20,000.
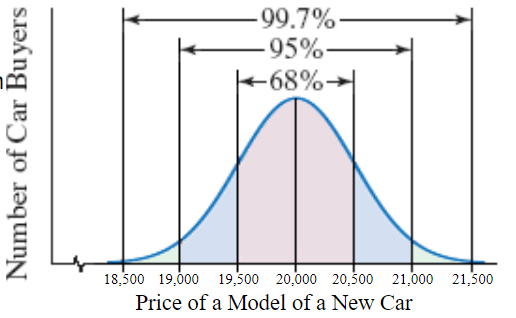
18500 is 3 standard deviations below the mean, which would half of 99.7%
.5 (99.7) = 49.85%
100
A set of data items is normally distributed with a mean of 80 and a standard deviation of 6. Convert 101 to a z-score.
z = (101-80)/6 =3.5
200
Find the (a)standard deviation and (b)range
Round to the nearest tenth if needed.
{24, 73, 30, 56, 22, 81}
a. Standard Deviation = 25.9 sqrt((sum (x - barx)^2)/(n-1))
b. Range =59 (highest value- lowest value)
200
Scores on the GRE (Graduate Record Examination) are normally distributed with a mean of 559 and a standard deviation of 82.
Use the 68-95-99.7 Rule to find the percentage of people taking the test who score between 395 and 723.
z= (x-barx)/s
Solve Z_395 = (395-559)/82 and Z_723 = (723-559)/82
Z_395 = -2, Z_723 = 2
395 is 2 standard deviations below the mean
723 is 2 standard deviations above the mean
Therefore the percentage is 95%.
200
A farmer's chickens lay an average of 14 eggs per day with a standard deviation of 3 eggs. Find the z-score of Henny Hen, who laid 13 eggs today.
z = (13-14)/3
z = -1/3 or -0.333..
300
Use the display of data to find the a) mean, b) median, c) mode, and d) midrange.
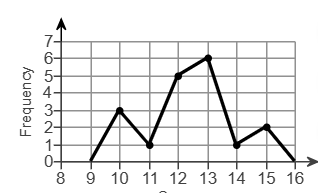
a) mean = 12.4 ( sum score * frequency)/ total frequency
b) median = 12.5 (middle number of ranked data)
c) mode = 13 (the number that occurs the most)
d) midrange = 12.5 (highest value + lowest value )/2
300
What is the mean in this data set?
What is the standard deviation?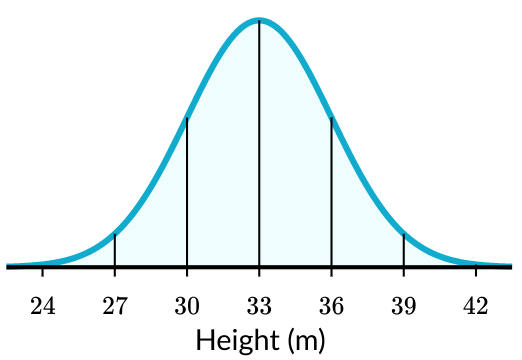
mean = 33 m
standard deviation = 3m
300
The scores on a test are normally distributed with a mean of 90 and a standard deviation of 18.
What is the score that is 2 1/2 standard deviations below the mean?
x = barx + z * s
x = 90 - 2.5(18)
x = 45
400
Given the data: {86, 42, 39, 47, 42, 53}
find the median
median = 44.5
400
What percent of the data is between 30 and 36 meters?

68%
400
The weights for 12-month-old males are normally distributed with a mean of 22.8 pounds and a standard deviation of 2.4 pounds. Use the given table to find the percentage of 12-month-old males who weigh between 16.8 and 18 pounds.
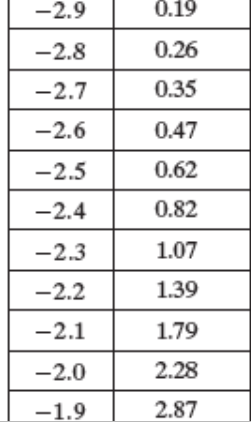
z -score for 16.8 = -2.5, percentile is 0.62
z -score for 18 = -2, percentile is 2.28
Find the difference = 2.28-0.62 = 1.66%
500
Given the data: {86, 42, 39, 47, 42, 53}
find a) mode, b) midrange
a) mode = 42
b) midrange = 62.5
500
a) What percent of the data is greater than 42 meters?
b) If 2,000 trees were measured here, how many are shorter than 24 m?

a) 0.15%
b) .0015(2000) = 3 trees
500
Find the mean if z=2.5, x=20 and the standard deviation is 4.
x = barx - z * s
20 = barx +2.5 * 4
20 - 10 = barx
mean = 10