Likelihood
Theoretical & Experimental Probability
More Theoretical & Experimental Probability
Compound Events
Simulations & Random
100
The probability of an event is 55%. Describe the likelihood of the event.
likely
100
You randomly draw a marble from a bag, record its color, and then replace it. You draw a red marble 7 out of 25 times. What is the experimental probability that the next marble will be red?
28%
100
You roll a number cube and record an odd number 16 times in a row. As the number of times you roll an odd number increases, what happens to the theoretical probability that you roll an even number?
It increases.
100
Draw a tree diagram to find the total number of possible outcomes when you select one type of meat and one type of bread for a sandwich. Your meat choices are ham, turkey, pastrami and roast beef. Your bread choices are wheat or rye.
8 outcomes
100
A claw arcade machine contains jewelry and iphones. There are 48 items in the machine. Winning jewelry has three times as many favorable outcomes as winning an iphone. How many of each item is in the machine?
12 iphones and 36 jewelry outcomes
200
There is an 80% chance of a thunderstorm on Saturday. Describe the likelihood that there is not a thunderstorm on Saturday.
unlikely
200
There are 4 red marbles and 12 orange marbles in a bag. You randomly choose one of the marbles. What is the probability of choosing a red marble?
25%
200
This table shows outcomes of a number cube with six equal sides numbered 1, 2, 3, 4, 5, and 6.
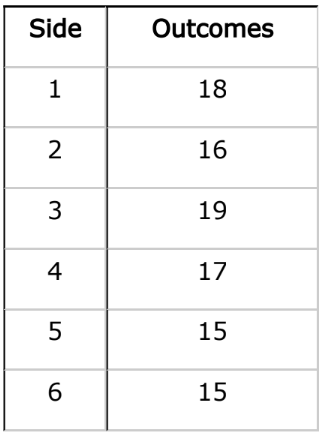
Based on the outcomes, enter the number of times the number cube is expected to land on 5 if it is rolled 40 times.
6 times
200
You roll a six-sided number cube and flip a coin. Draw a table to find the probability of rolling a number less than three and flipping tails. Round your answer to the nearest 10th.
1/6 or 16.7%
200
You use a simulation to find an experimental probability. How does the experimental probability compare to the theoretical probability as the number of trials increases?
The experimental probability should get closer and closer to the theoretical probability as the number of trials increase.
300
There is a 20% chance of snow flurries, a 65% chance of rain, and a 50% chance of sunshine tomorrow. Describe the likelihood of each event.
a. There is snow tomorrow.
b. There is rain tomorrow.
c. There is sunshine tomorrow.
a. unlikely
b. likely
c. equally likely to happen or not happen
300
A spinner has numbers 1 through 6 equally represented. After spinning 50 times, you spin 9 ones, 12 twos, 8 threes, 15 fours, 3 fives and 3 sixes. Develop a frequency model to predict the number of times you will spin a four when you spin a spinner 100 times.
30 times
300
A spinner with two equal portions, purple and yellow, is spun 2 times.
Enter the probability of the spinner landing on purple both times.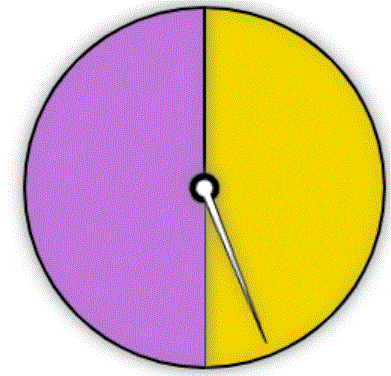
1/4 or 25%
300
Use the Fundamental Counting Principal to find how many different home theater systems you can make from 6 DVD players, 8 TVs, and 3 brands of speakers.
144 home theater systems
300
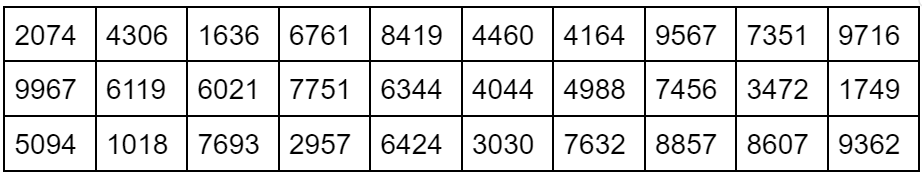
A medicine is effective for 80% of patients. The table shows 30 randomly generated numbers from 0 to 999. Use the table to estimate the probability of the medicine being effective on each of three patients. Let the numbers 1-8 represent the medicine being effective.
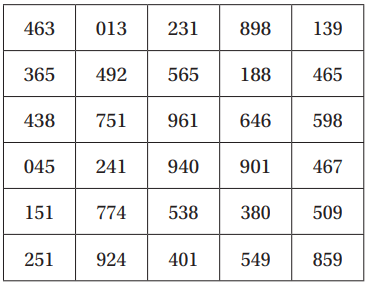
1/2 or 50%
400
A box contains 8 red marbles, 2 blue marbles, 2 green marbles, and 2 yellow marbles. Determine whether each statement correctly describes the likelihood of an event.
Select True or False for each statement.
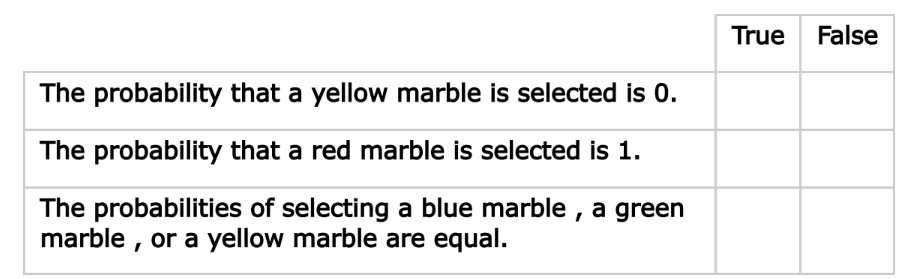
False
False
True
400
A deck of 10 cards, labeled 1 through 10, is shuffled. A card is drawn at random and then shuffled back into the deck. This is repeated two more times. The card labeled with the number 8 is drawn 2 out of the 3 times. The predicted probability of drawing the card with the number 8 when one card is drawn is 1/10.
Select the statement that best explains why the observed frequency is different from the predicted probability.
A. They most likely differ because the sample size is too small (not enough trials).
B. They most likely differ because a card is drawn more than 1 time.
C. They most likely differ because the predicted probability is inaccurate.
D. They most likely differ because 2/3 and 1/10 have different denominators.
A
400
This table shows the outcome of a spinner with three equal sized sections colored red, blue, and white.
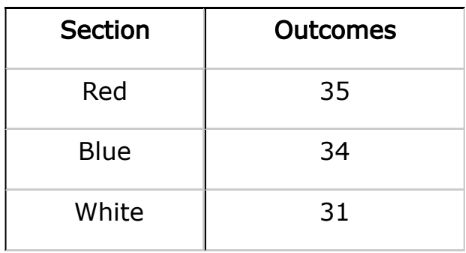
Based on the outcomes, enter the number of times the arrow of the spinner is expected to land on the red section if it is spun 20 times.
7 times
400
What is the probability of rolling a number greater than 4 and flipping tails?

2/12 or 1/6 or 16.6...%
400
Silver Star wild card...
Surprise!! Each member of your group gets a silver star!
500
A radio station is giving away shirts. In the box of shirts there are 6 small shirts, 10 medium shirts, 26 large shirts, and 8 XL (extra-large) shirts. Each person reaches in and randomly pulls out a shirt.
Determine whether each statement correctly describes the likelihood of an event based on the box of shirts. Select True or False for each statement.
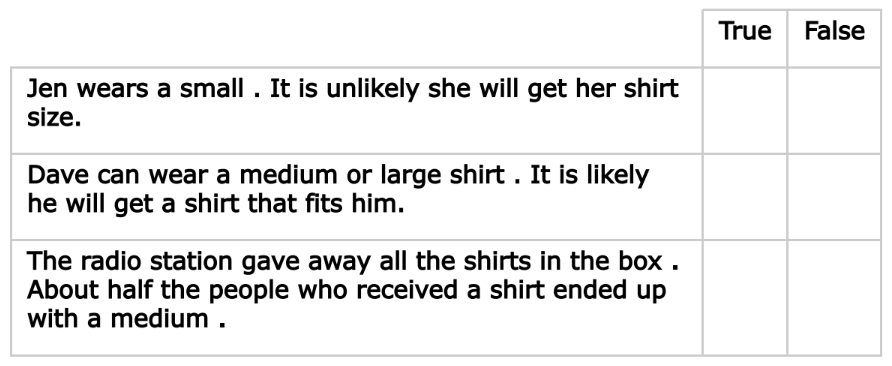
True
True
False
500
Claire is performing a probability experiment. She has a bucket of marbles, with each marble colored red, yellow, blue, or orange. She randomly removes a marble, records the color, returns the marble to the bag, and mixes the marbles. She repeats this procedure 100 times. Using the data from the experiment, Claire makes the following predictions:
There are about 2 times as many red marbles as blue marbles. The probability of randomly removing an orange marble from the bag is about 1/5.
Select the list that could represent the data from the experiment.
A. red 20, yellow 48, blue 11, orange 21
B. red 25, yellow 7, blue 49, orange 19
C. red 16, yellow 49, blue 30, orange 5
D. red 45, yellow 28, blue 22, orange 5
A
500
Martin has a fair 6-sided cube with colored faces. He rolled the cube 240 times. He recorded the color that was facing up after each roll. His results are shown in the table.
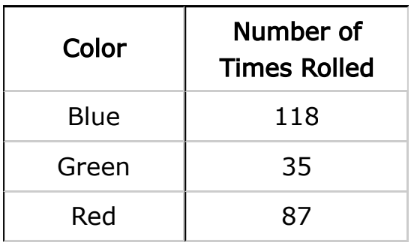
Based on the table, what is the most likely number of sides of Martin’s cube that are blue?
A. 1; B. 2; C. 3; D. 4
C
500

Silver Star wild card...
Surprise!! Each member of your group gets a silver star!
500
Each day for the next 4 days, there is a 50% chance of a sunny day. Use the simulation shown, where the digits 4 through 9 represent sunny days, to estimate the probability of a sunny day, at least 2 of the next 4 days.

19/30 or 63.3...%