Theoretical probability
Experimental Probabiity
Histograms
Other Graphs
Grab Bag
100
Each of the letters in the word APPLE is on separate card, face down on the table. If you pick a card at random, what is the probability that its letter will be a P or E?
3/5
100
I rolled the following on a die: 6, 1, 4, 3, 2, 3, 4, 2, 5, & 6. What was the experimental probability of rolling a 2?
1/5
100
Give 2 ways a histogram is different from a bar graph.
1. Bars touch
2. Each bar represents a range or interval of numbers.
3. Other possible answers???
100
Give 2 names for this type of graph.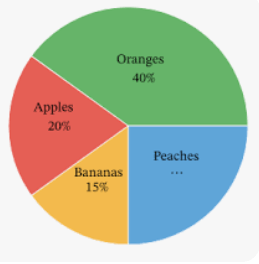
1. Circle graph
2. Pie graph/chart
100
Give 3 possible solutions:
3x + 4 < 10
Any 3 numbers less than 2
200
A magician showed a magic trick where he picked one card from a standard deck. Determine what the probability is that the card will be a queen card?
1/13 or 4/52
200
You flipped a coin 100 times and landed on heads 44 times and tails 56 times. What was the experimental probability of landing on heads?
44/100 or 11/25
200
How many people were over the age of 70?
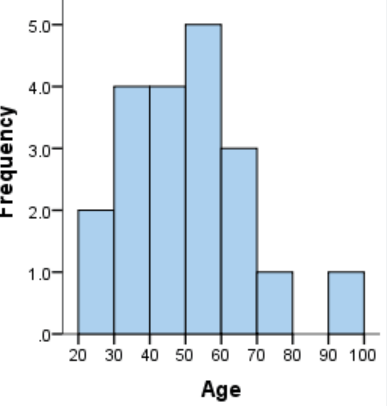
2
200
If 150 students were polled, how many said supreme was their favorite type of pizza?
15
200
You bought a $35 pair of jeans, but used a 25% off coupon. How much did you pay?
$26.25
300
A bag contains 5 blue sticks, 4 red sticks, and 3 orange sticks and you ask a friend to pick one without looking. What is the probability that the stick will be red? Answer as a simplified fraction!
1/3
300
I drew 60 times from a bag containing 2 blue, 4 yellow, 6 red, and 2 green marbles. I drew a red marble 24 times. What was the experimental probability of drawing a red? Give as a simplified fraction
2/5
300
How many employees make less than $20,000?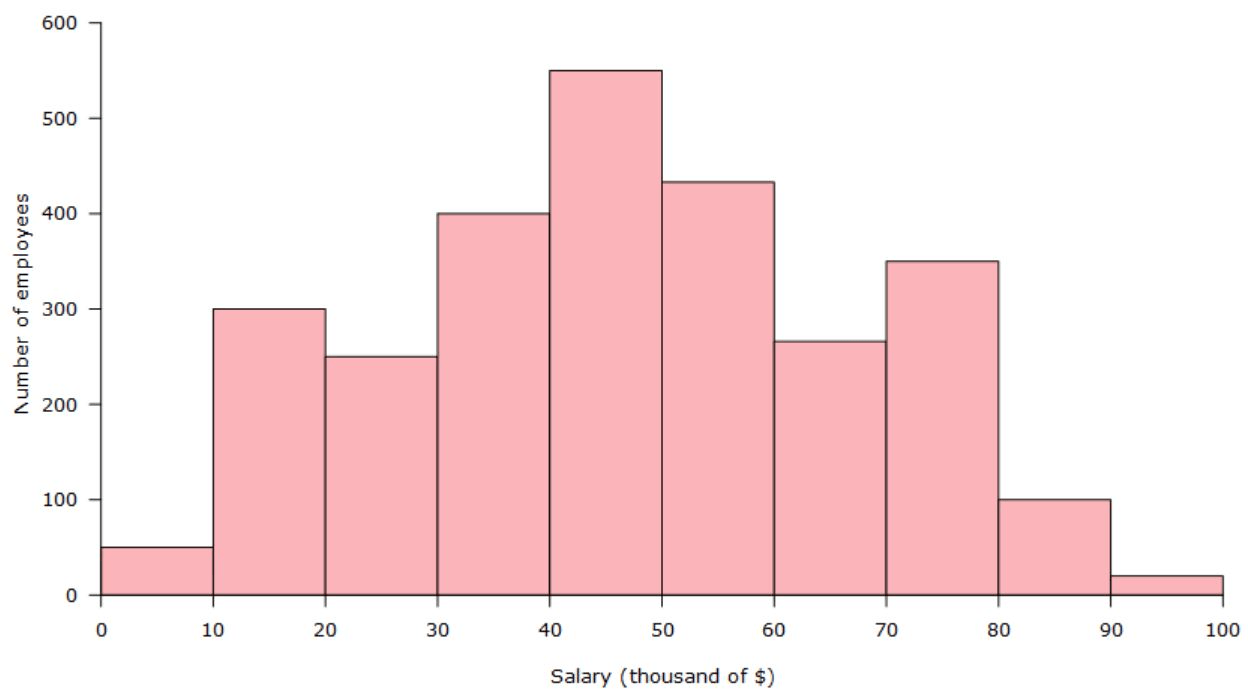
350
300
Chandler made a stem and leaf diagram of how many points each member of her gym class scored during a basketball tournament. If she is using this data to make a histogram, how many classmates would be in the 41-50 interval?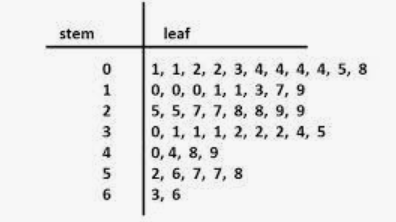
3
300
Solve:
(x + 5)/9 = 3
x = 22
400
Jill is playing cards with her friend when she draws a card from a pack of 20 cards numbered from 1 to 20. What is the probability of drawing a number that is perfect square?
DOUBLE POINTS IF ONE OF YOU CAN EXPLAIN IN WRITING!
1/5 (1, 4, 9, 16 = 4/20 = 1/5)
400
Look at the table below and determine the experimental probability of drawing a pink marble.
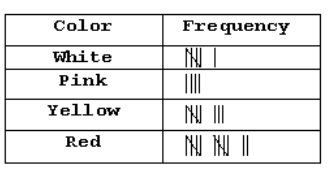
4/30 or 2/15
400
What was the LEAST common interval? (represent your answer as an interval, not an individual number).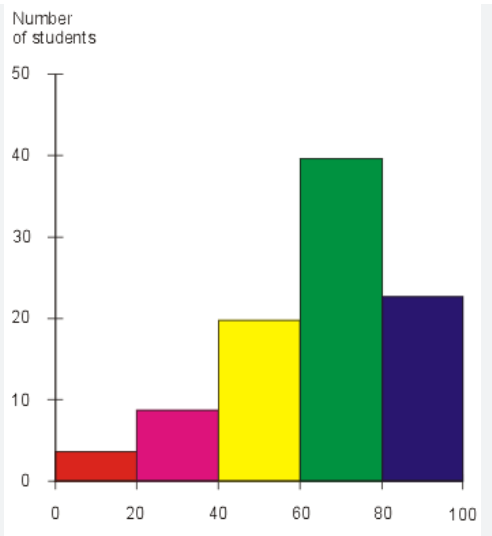
0-19
400
What kind of graph is this, and what is it used for?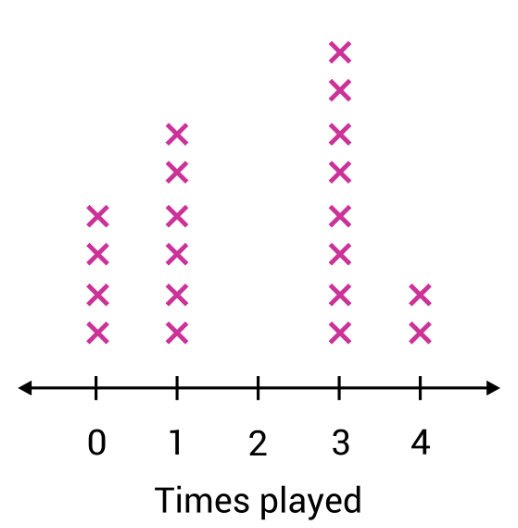
It's a line plot, which is used to show frequency of data points on a number line. (Other explanations are acceptable.)
400
Write in standard form?
1/(10*10*10*10)
0.0001
500
You have scrabble tiles in a bag that spell the word PROBABILITY. What is the probability that you reach in and draw an I or B?
4/11
500
I drew 60 times from a bag containing 2 blue, 4 yellow, 6 red, and 2 green marbles. I drew a red marble 12 times. What was the experimental probability of drawing a red?
a) What was the experimental probability of drawing a red?
b) Is this <, >, or = to the theoretical probability?
a) 1/5
b) Greater than
500
What are 2 things that are wrong with this histogram?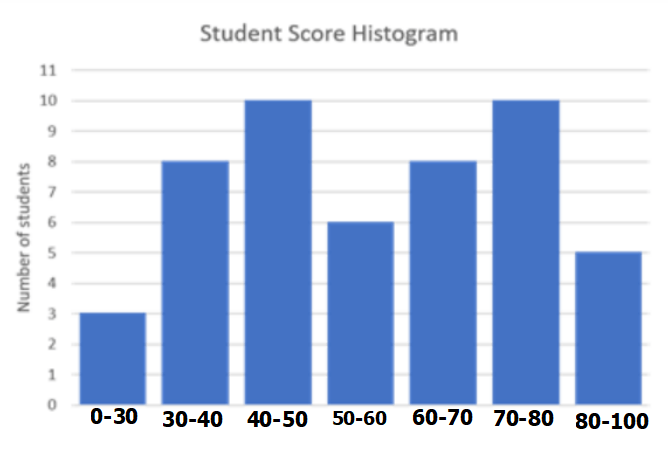
1. There are spaces between the bars
2. The intervals overlap.
3. ???
500
Explain why this histogram does or doesn't represent the data in the stem and leaf diagram.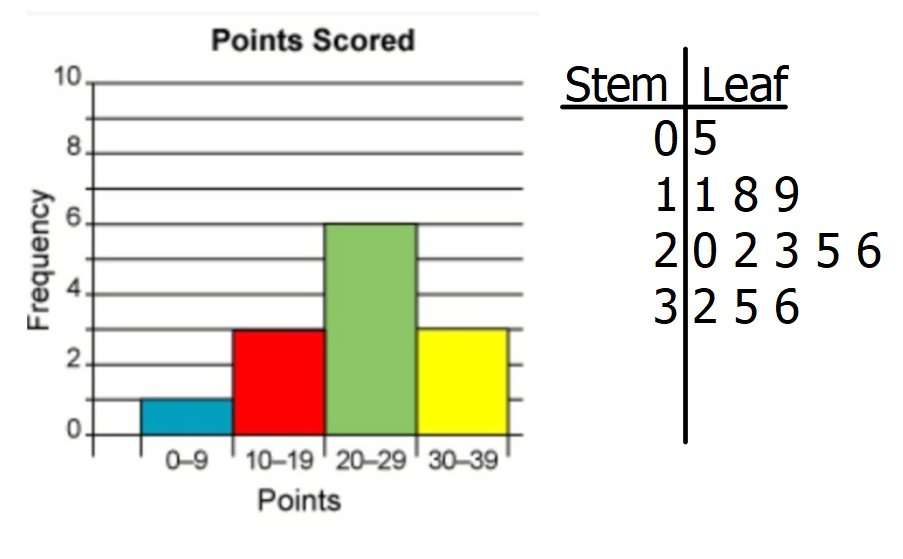
It does not because there are 6 items in the 20-29 interval on the histogram, but 5 items in the stem and leaf.
500
What is the y-intercept of this equation?
y = 3x
b = 0