Probability Rules
Calculating Probability
Studies & Sampling
Data & Measurements
Data Visualizations
Centers & Spreads
100
TRUE or FALSE: The probability of two events A and B is always equal to P(A) x P(B).
FALSE. This is true only if A and B are independent.
100
What the probability of rolling a an even number on a six sided die?
1/2 or 50% or .50
100
I count how many Teslas drive past me in one hour. What type of study is this?
Observational Study
100
What type of data is the heights of students in this class?
Quantitative
100
What is the name of this type chart:
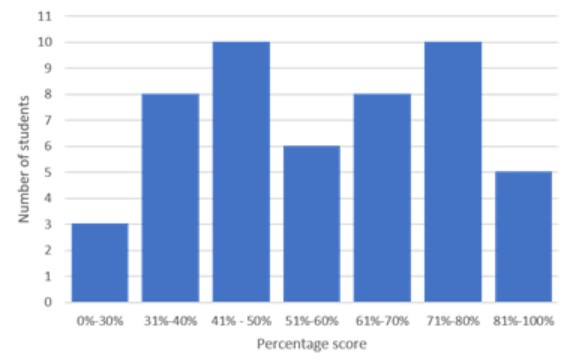
Histogram
100
What is the MEDIAN of this dataset: {2, 3, 9, 10, 11}
9
200
How many students play soccer in this diagram?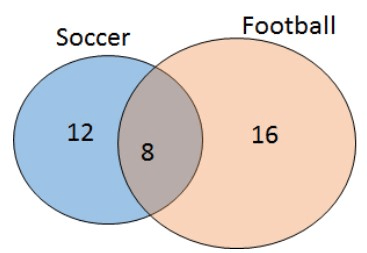
20
200
Write a number that CANNOT be the probability of an event.
Any number less than 0 or greater than 1
200
I put every student's name in a bag and select five without looking. What sampling method is this?
Simple Random Sampling
200
What type of data is the ZIP codes of students in this class?
Qualitative or Categorical
200
Describe the shape of this distribution: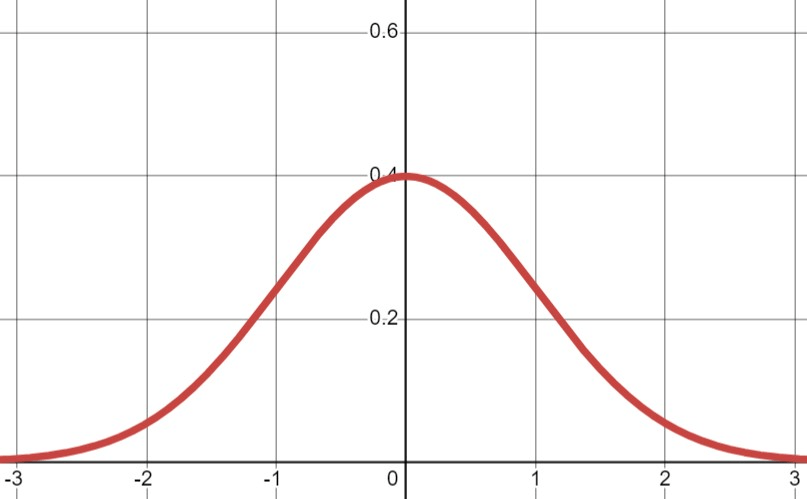
NORMAL or BELL-SHAPED
200
What is the MEAN of this data set: {2, 3, 9, 10, 11}
7
300
What do we call the set of ALL possible outcomes of an event?
Sample Space
300
There are 6 red and 4 blue marbles in a bag. You pick two marbles WITH REPLACEMENT. What is the probability that both marbles are blue?
0.16 or 16/100 or 16%
300
A researcher wants to know how many people will vote for Trump in November. What type of study should they conduct?
Survey
300
Three students finished 1st, 4th, and 9th in a race. What level of measurement is this data?
Ordinal
300
Describe the shape of this distribution:
Right-skewed
300
Does adding outliers (extreme values) affect the median of the set?
No
400
If P(A) = 0.30 then P(not A) = ?
0.70
400
There are 6 red and 4 blue marbles in a bag. You pick two marbles WITHOUT REPLACEMENT. What is the probability that both marbles are blue?
12/90 or .133 or 13.3%
400
What type of study is best for determining whether a new drug is effective or not?
Experimental Study
400
Give an example of a NOMINAL level of measurement.
Data that is measured with names or categories (example: hair color)
400
What type of number is on the y-axis of a RELATIVE FREQUENCY HISTOGRAM?
Percentages
400
What is the VARIANCE of this data set: {4, 4, 4, 4, 4}
Zero
500
Write an example of an event with a probability of 1.
Something GUARANTEED to happen
500
Write an algebraic expression for the probability of flipping all heads when you flip a coin X times.
(1/2)x
500
I stop 20 people as they wait in line at Starbucks ask them their favorite place to buy coffee. Is this a biased sample? EXPLAIN
Yes, because the people I ask are likely to prefer Starbucks.
500
Give an example of DISCRETE data.
Data that can be counted in whole numbers (example: number of students in this class)
500
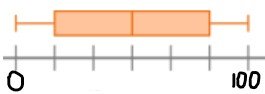
Draw a box plot with a range of exactly 100.
500
In this class the mean student height is 68 inches with a variance of 3 inches. A new student joins who is 51 inches tall. Does the variance increase or decrease? EXPLAIN
It increases because the new student's height is more than 3 inches away from the mean.