Venn Diagrams
Theoretical
Theoretical Venn Diagrams
Rolling a Die
Correlation Review
100
A group of people were surveyed on what pets they own, how many people own a cat but not a dog.
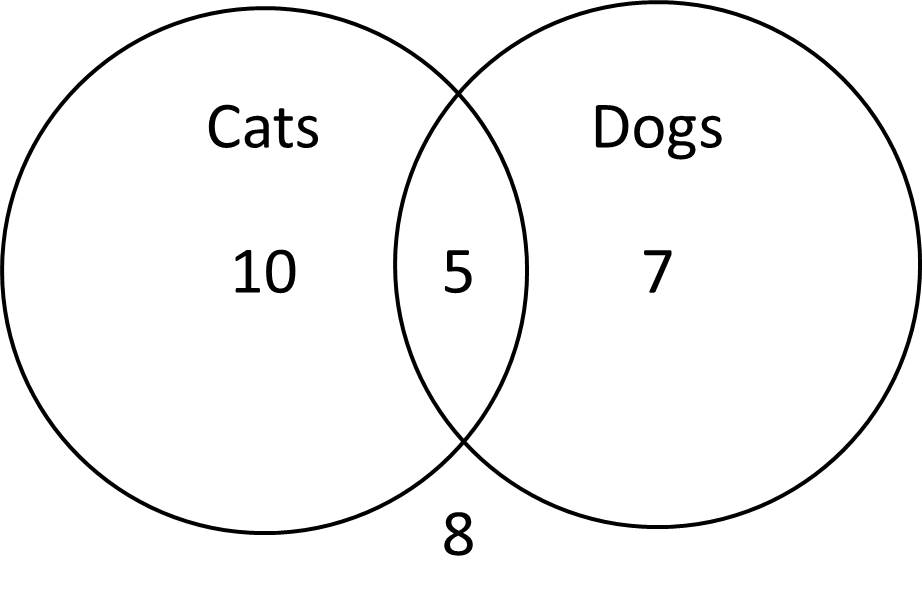
10
100
What is the probability (as a fraction), that the spinner lands on the color red:

1/6
100
15 students were surveyed on if they had Instagram or TikTok. The results are shown in the Venn Diagram below. Find P(Instagram and TikTok)
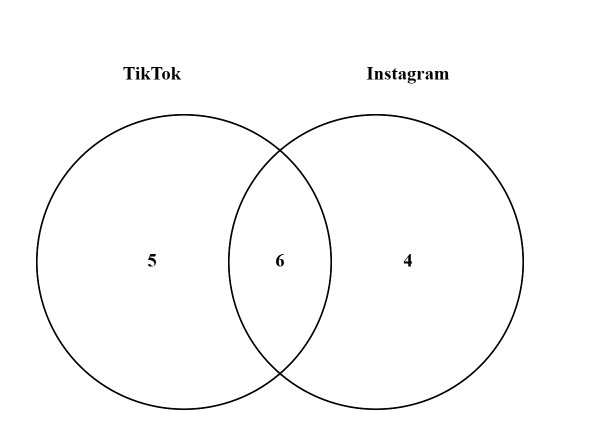
6/15=2/5
100
What is the probability of rolling a one? Reduce the fraction.
(1/6)
100
Name the correlation:
The number of people in a room and the number of days it rains.
No correlation
200
A group of people were surveyed on what pets they own, how many people own a cat or dog
22
200
A crayon box contains 1 red, 2 blue, and 4 green crayons. If a crayon is chosen at random, what is the probability that it is blue.
2/7
200
15 students were surveyed on if they had Instagram or TikTok. The results are shown in the Venn Diagram below. Find P(Instagram and not TikTok)
4/15
200
What is the probability of rolling an even number? Reduce the fraction.
(1/2)
200
Name the correlation
Number of absences from a class and Grade in the class
Negative Correlation
300
A group of people were surveyed on what pets they own, how many people own a cat and dog
5
300
A number from 1-20 is selected at random, what is the probability of selecting a multiple of 3
6/20=3/10
300
25 students were surveyed on what kind of cookie the like. The results are shown in the Venn Diagram below: Find P(Chocolate chip and Sugar cookie)
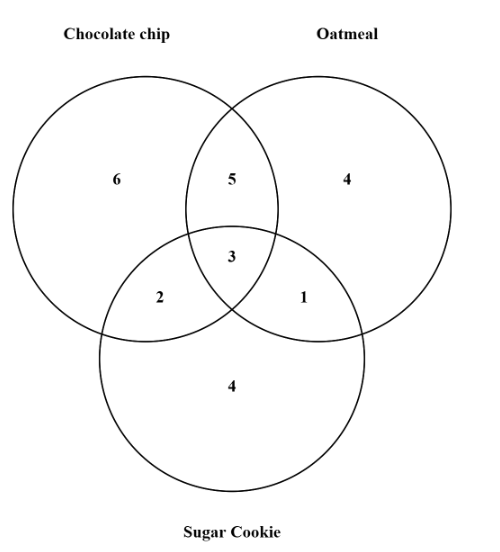
5/25=1/5
300
What is the probability of rolling an eight?
Reduce the fraction.
0
300
Describe the correlation based on the correlation coefficient.
r = -0.3
Weak, negative correlation
400
A group of people were surveyed on what pets they had, based on the Venn Diagram below, how many people own birds.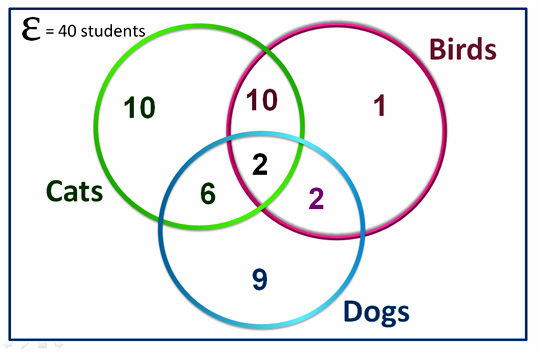
15
400
The probability of snow is 5/11, what is the probability it will not snow.
6/11
400
25 students were surveyed on what kind of cookie the like. The results are shown in the Venn Diagram below: Find P(Chocolate chip but not oatmeal)
8/25
400
What are the possible outcomes of rolling a die?
1, 2, 3, 4, 5, 6
400
Describe the correlation based on the correlation coefficient.
r = 0.925
Strong, Positive Correlation
500
A group of people were surveyed on what pets they had, based on the Venn Diagram below, how many people own birds or dogs but no cats.
12
500
A letter from the words MATCHA is selected at random, what is the probability of not selecting the letter A
4/6=2/3
500
25 students were surveyed on what kind of cookie the like. The results are shown in the Venn Diagram below: Find P(All three cookies)
3/25
500
What is the probability of rolling a number that is greater than 4? Reduce the fraction.
(1/3)
500
Describe the correlation based on the correlation coefficient.
r = 0
No correlation