Probability Tree
Statistical Measure
Range & IQR
Boxplots
100
A type of graph that shows all of the possible outcomes using branches that spread out
Tree Diagram
100
How do you find the mean?
Add up all your numbers / by the amount of numbers
100
What is the formula for range?
Range = Max- Min
100
What is the median (Q2) of this boxplot?
7
200

1/4 or 25%
200
How do you find the median?
Median = middle value
Use the cross off method when the numbers are IN ORDER FROM LEAST TO GREATEST
200
What does IQR stand for?
Interquartile range
200
What is the range of this boxplot?
9 - 2 = 7
300
What is the probability of getting one head and one tail?
1/2 or 50%
300
{9, 10, 12, 13, 13, 13, 15, 15, 16, 16, 18, 22, 23, 24, 24, 25}
What is the median?
15.5
300
What is the formula for IQR?
IQR = Q3 - Q1
300
Does boxplot 1 or 2 have a greater range?
2
400
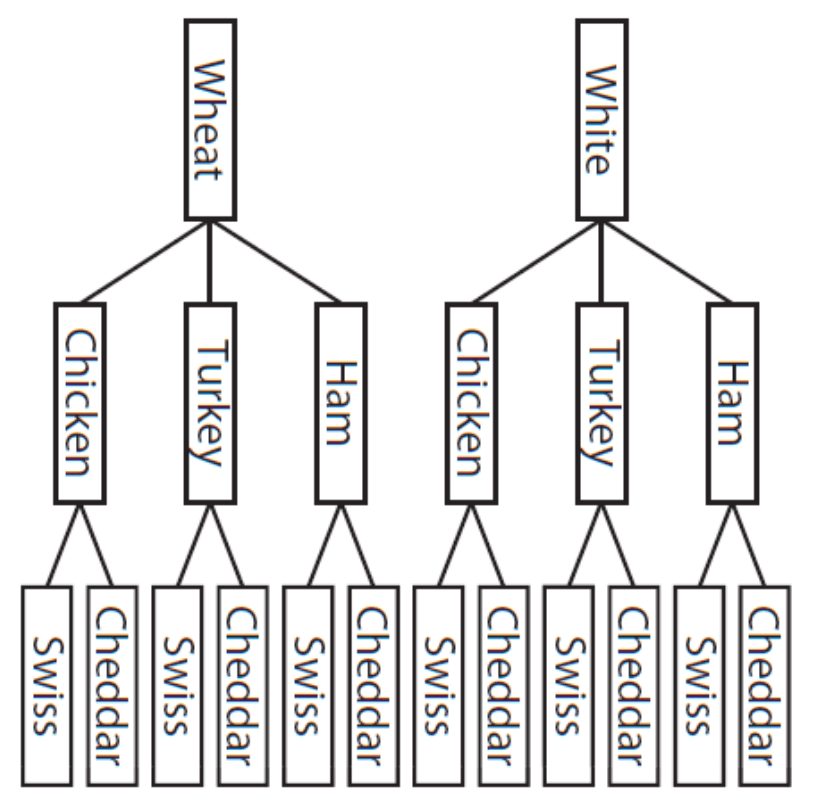
What is the probability of choosing a sandwich with swiss cheese?
1/2 or 50%
400
{9, 10, 12, 13, 13, 13, 15, 15, 16, 16, 18, 22, 23, 24, 24, 25}
Calculate the mean.
16.75
400
Find the IQR
8-3 = 5
400
What percent of this boxplot scored below an 8?
Each section is 25% --> so 75%
500
Find the probability of choosing a sandwich with chicken or ham.
2/3 or 67%
500
{9, 10, 12, 13, 13, 13, 15, 15, 16, 16, 18, 22, 23, 24, 24, 25}
What is the standard deviation?
*Use your calculator!
Sx = 5.29
500
{9, 10, 12, 13, 13, 13, 15, 15, 16, 16, 18, 22, 23, 24, 24, 25}
Find the IQR
IQR = 22.5-13 = 9.5
500
Draw a box plot with the following:
Minimum is 1
Quartile 1 is 7
Quartile 2 is 8
Quartile 3 is 10
Maximum is 14
Mrs. Acevedo will judge your drawings!