Probability
Mean, Median, Mode
Data Distribution
Correlation
Linear Regression
100
Probability is a number between or including ___ and ___.
0, 1
100
What is the mode of this data set?
3, 7, 7, 9, 11, 7, 15, 15
7
100
What shape does a normally distributed set of data make?
A bell-shaped curve
100
In a scatter plot, if there is no relationship between the x and y values, we would say this graph has _______ correlation.
no
100
What is the term for a line drawn through a scatter plot that can be used to make predictions about the relationship between the data?
Line of best fit
200
A spinner has 8 equal sections numbered 1 through 8. What is the probability of spinning a number greater than 6?
1/4
200
Calculate the mean of the following data set: 12, 15, 18, 20, 25.
18
200
When labeling a normal distribution curve, what value goes on the center line?
The mean
200
Which type of correlation does this scatter plot have?

positive
200
If the equation of a line of best fit through a data set is y = 4x - 2, predict the value of y when x is 25.
98
300
You draw one card from a standard deck. What is the probability that the card is either a heart or a king?
4/13
300
Identify the median of this data set: 19, 10, 8, 16, 5, 14, 22
14
300
A data set has a mean of 120 and a standard deviation of 12. List the numbers you would label the bell curve with from 2 standard deviations to the left and 2 standard deviations to the right of the mean (include the mean).
96, 108, 120, 132, 144
300
Which type of correlation does this scatter plot have?

none
300
Use a calculator to find the linear regression equation for this set of data. Round decimals to the nearest tenth.
y = 0.2x + 10.6
400
Is the following scenario an example of independent or dependent events?
A box contains 6 green, 4 yellow, and 2 red tiles. A tile is selected and kept out, then a second tile is selected. What is the probability the first is green and the second is yellow?
Dependent events
400
Sarah scores 82, 78, 90, and 86 on her first four math tests. What does she need to score on the first test to have a mean average of 85 in the class?
89
400
If the mean of a data set is 45 and the standard deviation is 6, what percentage of data would fall between 45 and 51 on the bell curve?
34.1%
400
In a scatter plot, if the values of y generally decrease as the values of x increase, we would say this graph has _______ correlation.
negative
400
Use a calculator to find the linear regression equation for this set of data. Round decimals to the nearest tenth.
y = -0.1x + 13888.7
500
A box contains 6 green, 4 yellow, and 2 red tiles. A tile is selected and kept out, then a second tile is selected. What is the probability the first is green and the second is yellow?
2/11
500
Which measure of central tendency (mean, median, or mode) would be most useful for a shoe store analyzing shoe sizes sold?
Mode
(Knowing which shoe sizes were sold the most could help them know which sizes to make sure they have stocked.)
500
If the mean of a data set is 24 and the standard deviation is 2.5, what percentage of data would fall between 21.5 and 26.5 on the bell curve?
68.2%
500
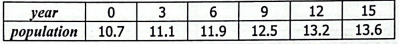
Using the table, determine which type of correlation this data shows. (*Hint: Sketch a scatter plot.)
positive
500
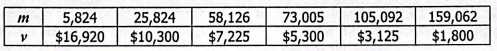
The table shows the mileage of cars, m, on 6 cars that were recently traded in along with their value, v.
Predict the value of a car with 13,258 miles to the nearest cent. Round the equation to the nearest tenth.

$12,695.45