Parts of the Scientific Method
Data Tables1
Data Tables2
Graphs
Identify the variable
100
The "If/Then" statement created that is a prediction of results obtained in a test.
Hypothesis
100
 What type of graph would be best for this set of data?
Bar Graph
100
What can you conclude from the Data Table below:

Water temperature decreases as you go deeper.
100
What is the independent Variable?
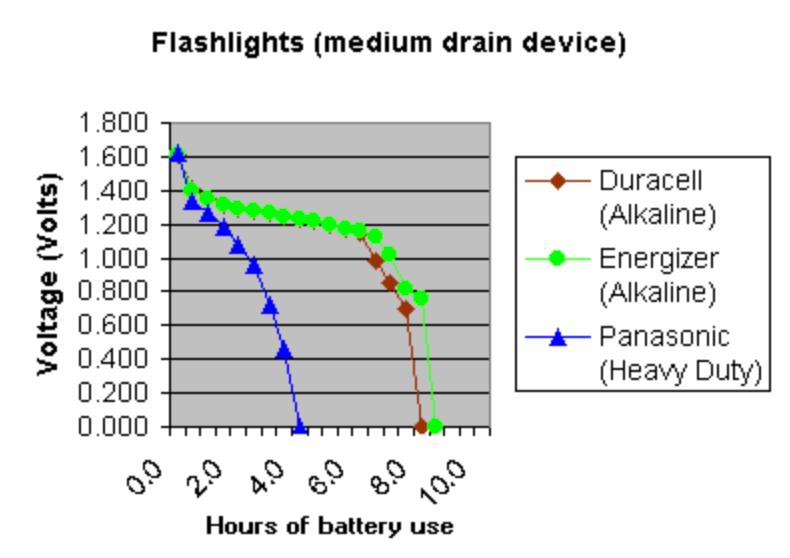
times battery use
100
A student tests 3 types of potting soil to see which one will grow the healthiest plants. He plants a grass seed in each type of potting soil and one in regular soil from his garden. He lets the plant grow for 3 months taking weekly measurement of height and records the information in a data table. What is the Independent Variable in this experiment?
The potting soil.
200
Part of the Scientific Method where you test your prediction.
Experiment
200
If graphed what information belongs on the X axis?
Species, I. V.
200
Which student walked the farthest? 
Frank
200
What did the scientist measure
voltage
200
A student tests 3 types of potting soil to see which one will grow the healthiest plants. He plants a grass seed in each type of potting soil and one in regular soil from his garden. He lets the plant grow for 3 months taking weekly measurement of height and records the information in a data table. What is the Dependent Variable in this experiment?
The height of the plants
300
Variable in an experiment that the scientist chooses.
Independent Variable
300
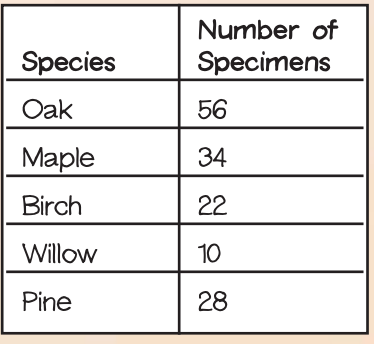 What information would be graphed on the Y axis?
Number of Specimen. D.V.
300
Which student took the most steps?
Sallie
300
Which use of water used the most water?

toilet flushing
300
A student tests 3 types of potting soil to see which one will grow the healthiest plants. He plants a grass seed in each type of potting soil and one in regular soil from his garden. He lets the plant grow for 3 months taking weekly measurement of height and records the information in a data table. Which group is the control group?
The ones grown in regular soil..
400
Variable in an experiment that is a result of the experiment.
Dependent varialbe
400
 Type of graph that would best display this data?
Line Graph (Changes over time)
400

Which student traveled the least distance?
Suzie
400
Which group sold the most in July?

7th graders
400
A student tests 3 types of potting soil to see which one will grow the healthiest plants. He plants a grass seed in each type of potting soil and one in regular soil from his garden. He lets the plant grow for 3 months taking weekly measurement of height and records the information in a data table. Name three things that should be constant in the experiment.
Type of seed, containers, water, sunlight, temperature, etc.
500
An explanation of your observations.
Inference
500
What is missing from the graph?
A title
500
Which student traveled the least distance per step?
Sally
500
Which axis is the independent variable?

X axis