Measurement
Scientific Method
Graphs
Data Tables
Which variable?
100
What tool is used to measure length?
ruler
100
The variable that scientists manipulate in an experiment is called this variable?
Independent
100
type of graph used to show changes over time
line
100
Which set of data should be included on the x-axis when graphing this data?
Salt Concentration
100
A student tests 3 types of potting soil to see which one will grow the healthiest plants. He plants a grass seed in each type of potting soil and one in regular soil from his garden. He lets the plant grow for 3 months taking weekly measurement of height and records the information in a data table. What is the Independent Variable in this experiment?
potting soil type
200
What tool is used to measure the volume of a liquid in science?
Graduated cylinder
200
The educated guess a scientist makes that is the basis of an experiment.
Hypothesis
200
What type of graph would best display the data below?
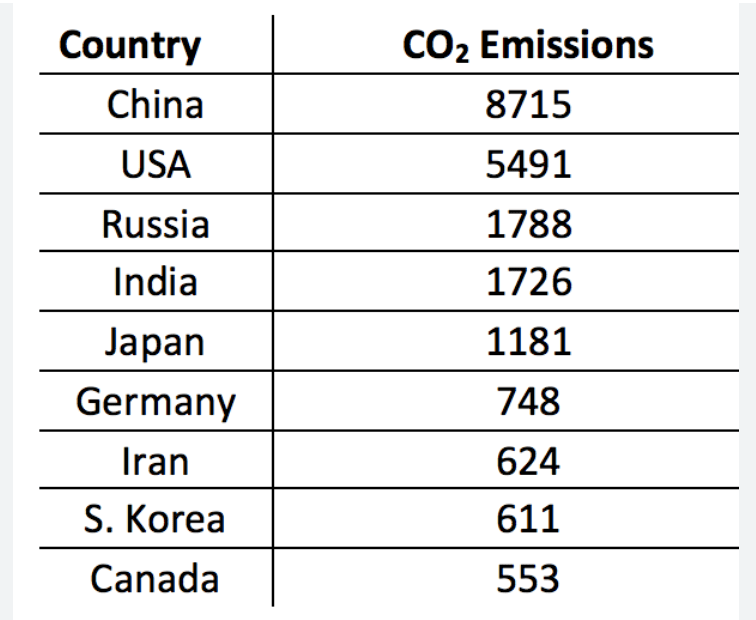
bar
200
The independent variable on the data table is what?
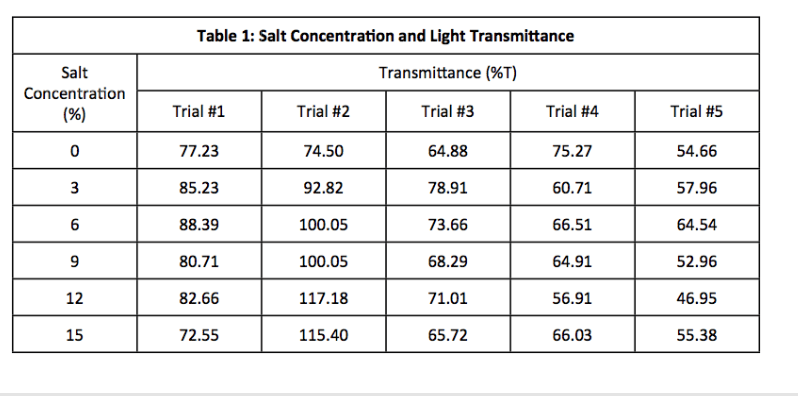
Salt Concentration
200
A student tests 3 types of potting soil to see which one will grow the healthiest plants. He plants a grass seed in each type of potting soil and one in regular soil from his garden. He lets the plant grow for 3 months taking weekly measurement of height and records the information in a data table. What is the Dependent Variable in this experiment?
Height of plants
300
Which tool would be used to measure mass in a science lab?
Triple beam balance
300
The variable that is measured as a result of the independent variable in an experiment.
Dependent
300
type of graph used to display the data below?
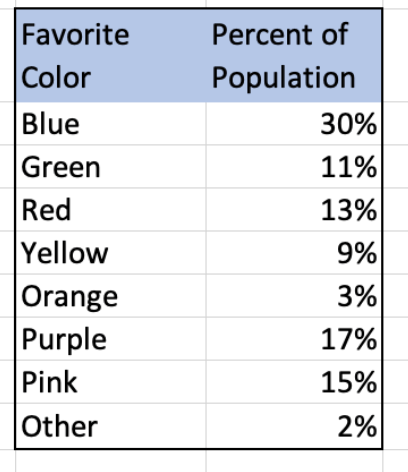
pie chart
300
The transmittance data below is the dependent variable. Which axis on a graph would represent this data?
Y-Axis
300
A student tests 3 types of potting soil to see which one will grow the healthiest plants. He plants a grass seed in each type of potting soil and one in regular soil from his garden. He lets the plant grow for 3 months taking weekly measurement of height and records the information in a data table. Which group is the control group?
The ones grown in regular soil..
400
Temperature is measured with which scientific tool?
thermometer
400
James hypothesized that dogs that eat only table scraps will live longer than dogs that eat dogfood. What would be the independent variable in his experiment?
type of food
400
Graph used to for comparisons of different groups
bar
400
Which information below would go in the left hand column on the data table?
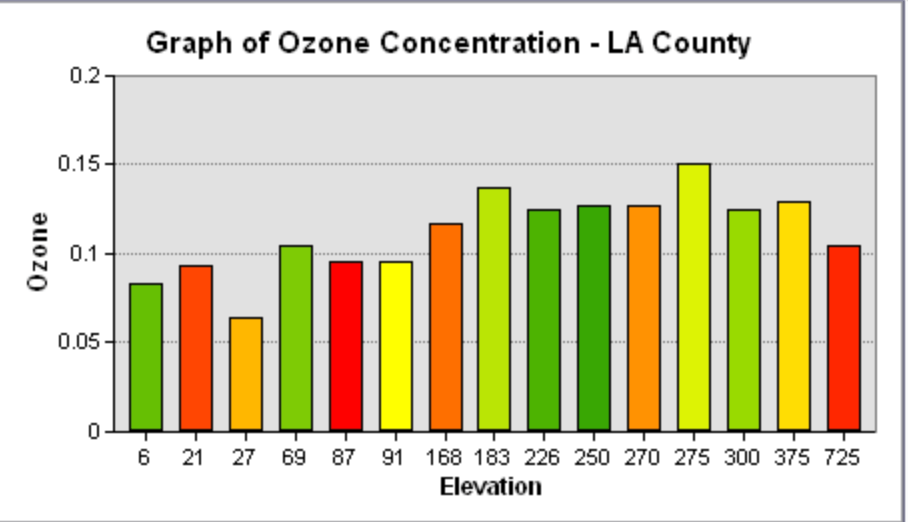
Elevation
400
A student tests 3 types of potting soil to see which one will grow the healthiest plants. He plants a grass seed in each type of potting soil and one in regular soil from his garden. He lets the plant grow for 3 months taking weekly measurement of height and records the information in a data table. Name three things that should be constant in the experiment.
Type of seed, containers, water, sunlight, temperature, etc.
500
What is the volume of the object that was dropped in the graduated cylinder below?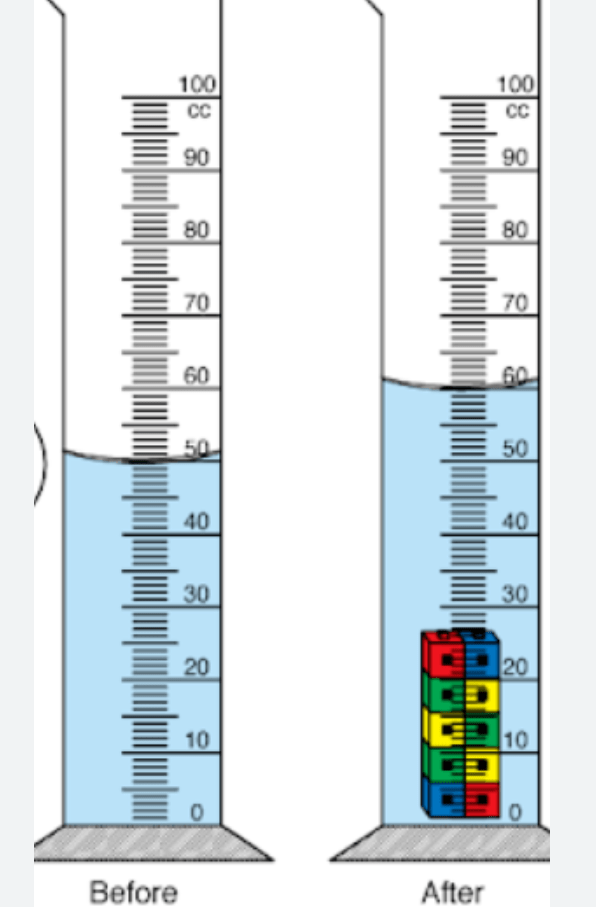
10 cc or 10 ml
500
The group that does not receive the independent variable is used to compare the experimental group to. What do we call this group?
Control group
500
Which category below is roughly 30%?
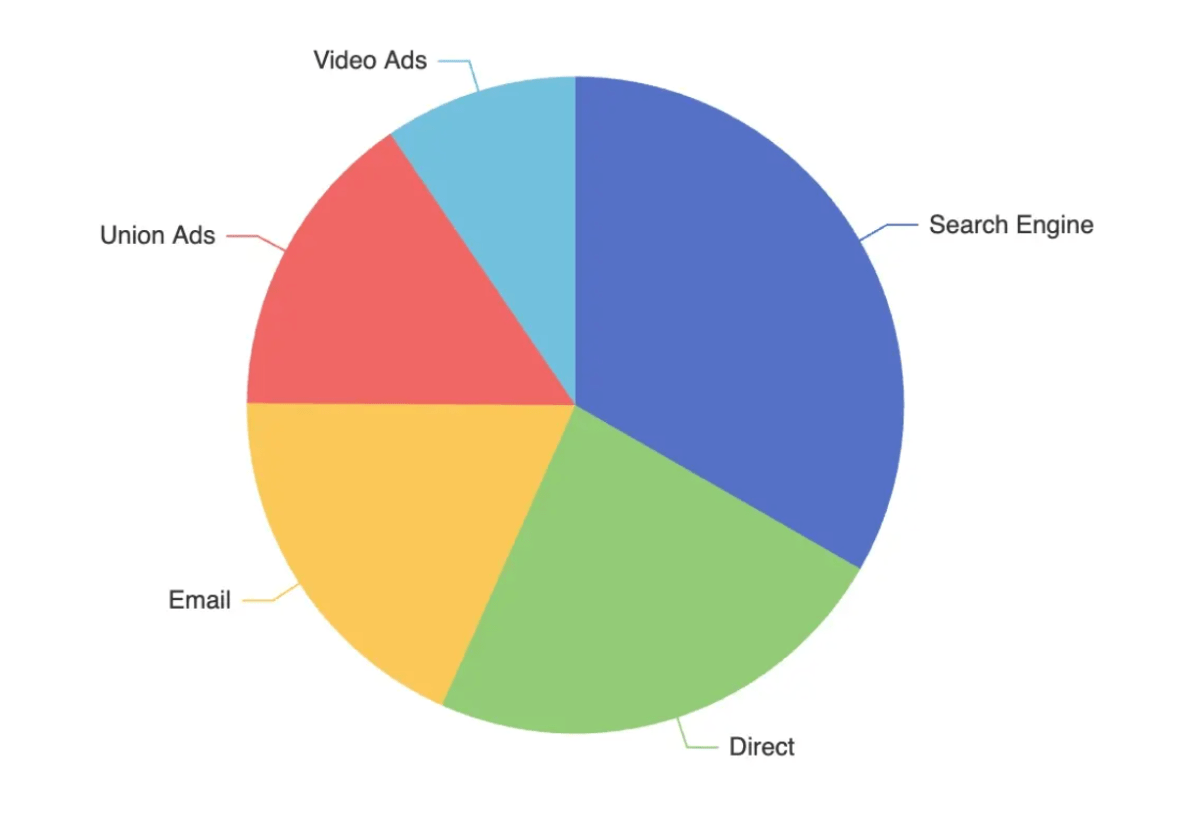
Search Engine
500
Why do scientists display data in a graph?
It helps visualize the data
500
The manipulated variable is also known as this variable.
Independent