Review
z-scores
Sample Means
t-test
Mystery
100
= Xmax – Xmin
Range
100
The information given by the sign (-/+) of the z-score.
If the score or sample mean falls above or below the population mean
100
The shape of the sampling distribution of sample means if n ~ 30
Normal
100
For an independent-measures study comparing two treatments with df = 48, what is n for each treatment (assuming equal number of participants in each treatment)?
n = 25 in each group
df = (n-1)+(n-1)
100
The hypothesis that states that there is no change in the general population before and after an intervention
The null hypothesis
200
The standard deviation of the following scores:
5, 5, 5, 5, 5, 5
0
200
z-score if X = 5, σ = 2, and µ = 6
-0.5
200
The standard deviation for all the possible sample means.
The standard error of M.
200
For an independent-measures research study, the two sample means are found to be M1 = 15.5 and M2 = 17. If the pooled standard deviation is 1.25, what would be the reported value of Cohen's d?
d = -1.2
(will accept +1.2)
200
A single, specific statistic that is used to test the hypotheses. Calculated from the sample data.
Test statistic
300
The skew of a distribution with a lot of high scores and not many low scores.
Negatively skewed
300
X if z = 1, σ = 10, and µ = 20
30
300
The standard error if σ = 100 and n = 100
10
300
For a repeated-measures study comparing two treatments with n = 26 scores in each treatment, the data produce t = 2.13. If the researcher is running a two-tailed test, what is the correct decision for a hypothesis test with α = .05?
Reject the null
300
The column in the unit normal table I should use if I am trying to identify the proportion of sample means would be GREATER THAN a sample mean that is BELOW the population mean (a positive z-score).
Column B - Proportion in the BODY
400
The mode in this dataset ...
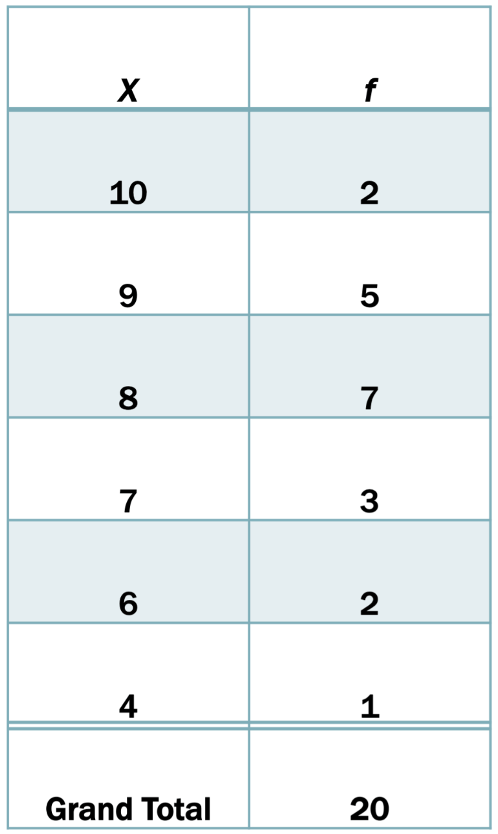
8
400
z-score (for M) if µ = 10, M = 5, σ = 2, and n = 16
-10
400
The column in the unit normal table I should use if I am trying to identify the proportion of sample means would be GREATER THAN a sample mean that is ABOVE the population mean (a positive z-score).
Column C - Proportion in the TAIL
400
If s2 = 20 and n = 5, what is the estimated standard error? (dependent sample t-test)
sMD = 2
sMD =
sqrt(s^2/n)
400
What I have done if I convert all my scores to z-scores, set a new mean and standard deviation, and now I have a new set of scores.
standardized the distribution / scores
500
The independent variable if a researcher randomly assigns participants to either eat spicy food or non-spicy food and measures their level of aggression afterward.
Spicy Food
500
The approximate proportion of the distribution that falls between -1 and +1 z-scores
68%
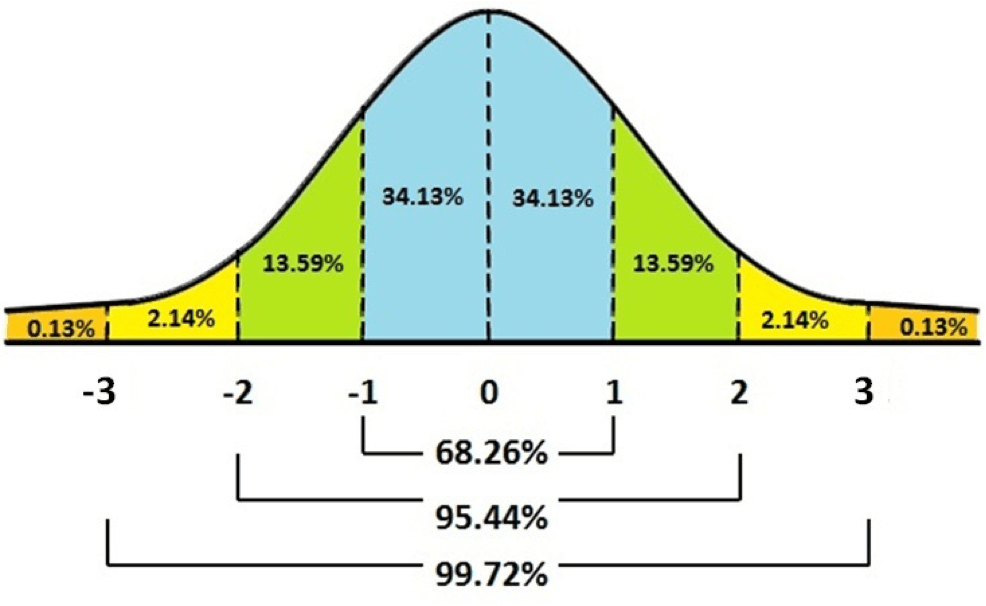
500
What happens to the standard error as I increase the sample size
↑ n = ↓ error
500
An independent-measures study with n = 8 in each treatment produces M = 86 for the first treatment and M = 82 for the second treatment. The estimated standard error is 8. What is t?
t = 0.50
500
The decision for a null hypothesis test if ...
α = .05
tails = one-tailed (increase score predicted)
z = -3.50
Fail to reject the null