Scale Design
Central Tendency and Variability
Z-scores and Histograms
Sampling
Bivariate Correlations
Experimental Design
Threats to Internal Validity
Decisions about Numbers
100
Slightly changing the wording on a previously validated scale to suit your research situation
Adapting a scale
100
The only measure of central tendency that can be reported for nominal data.
Mode
100
The correct description for a histogram that looks like this:

Skewed right/Skewed postively
100
A probability sampling method involving getting a list of the population and randomly sampling from that list.
Simple Random Sampling
100
The name for this type of graph (i.e., not the strength and direction of the relationship)

Scatterplot
100
A variable that may potentially have an impact on your dependent variable, and is aligned with only one of your levels of you independent variable, but isn't your independent variable itself. This is a huge problem for your study and indicates you need to stop and fix your study design to eliminate it. Far worse than an extraneous variable, which can be corrected via random assignment.
A design confound/Confounding variable
100
A threat to internal validity in which your research instrument becomes less valid over time, due to physical wear and tear, human fatigue or habituation on the part of an observer, or outdated language on a survey instrument.
Instrumentation Threat
100
The correct judgment of a person's IQ knowing they scored a Z-score of 0.5 on an IQ test.
Slightly above average IQ
200
A question that simultaneously measures two different variables, which should be avoided in scale design
A double-barreled question
200
The maximum value of a dataset, minus the minimum value of a dataset
Range
200
The correct description of a histogram that looks like this: 
Normal/Normal Distribution/Gaussian Distribution
200
The type of sampling that involves putting up flyers in town with a QR code to try to recruit participants.
Convenience Sampling
200
The strength and direction of a correlation with a Pearson's R of 0.2.
Weak positive correlation
200
The tendency for people to behave differently than they usually would in an scientific experiment when they know they are being observed (NOTE: I do not mean social desirability bias with this one)
Hawthorne Effect
200
An unplanned event that takes place during data collection in a study that involves collecting pre- and post-data, which might affect the results. A specific type of threat to Internal validity
History Threat.
200
The correct description of a scale with a Cronbach's Alpha of .98
A reliable measure, but probably repetitive.
300
The people required for the "Gold-Standard" method of translating a scale from another language
2 people bilingual in both languages
300
The correct measure of central tendency to report for a set of data on a continuous variable that is highly skewed right
Median
300
A Z-score for a person who scored a 50 on a test with a mean of 45 and a standard deviation of 5.
1
300
A sampling method involving asking participants to recruit other participants for you, a specific type of convenience sampling.
Snowball sampling
300
A datapoint that is extremely high compared to the rest of the datapoints, which will likely violate an assumption for a Pearson's correlation
An Outlier
300
An experiment in which all participants are exposed to all levels of your Independent variable instead of just being exposed to one
Within-subjects design/Within-subjects experiment
300
A threat to internal validity caused by people disproportionately quitting your study in one condition and not the other, because that condition encouraged people to quit.
Non-random attrition
300
What you should do if a scale has a Cronbach's alpha for .4, and a Cronbach's alpha if item 7 is deleted of .83
Delete Item 7 from the Scale
400
A type of bias characterized by having an response set that involves agreeing with all the items on a survey, even if the items contradict each other.
Acquiescence Bias
400
A measure of about how far away from the mean a randomly picked datapoint in a dataset will be, on average
Standard Deviation
400
The correct terminology for describing this histogram:
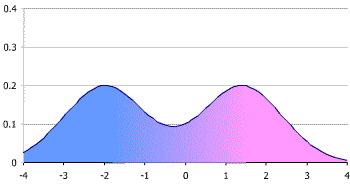
Bimodal/Bimodal Distribution
400
A probability sampling method involving getting a list of people in a population, splitting that list up by some demographic characteristic, like age, gender, or race, and then sampling from within each of those split lists to match the proportion of those demographics in the population.
Stratified Random Sampling
400
An assumption for a Pearson's Correlation involving there being an equal variance of the values of Y across the values of X. The scatterplot can't look like a fan, barbell, or tornado in order to satisfy this assumption.
Homoskedasticity
400
A strategy you should use to prevent carryover and order effects in a within-subjects design.
Counterbalancing
400
The threat to internal validity present in a study in which participants are assigned to a depression intervention condition based on having high levels of depression at time 1, which found that their depression got a lot better at time 2, compared to a control condition that didn't receive an intervention
Regression to the Mean
400
The correct judgement regarding the reliability of observations between two coders with a Cohen's Kappa of .2
Poor Reliability
500
The corrected score for a reverse-coded item on a scale from 1-100, where the participant originally answered a "61"
40
500
A measure of variability in a dataset that requires taking 3 medians to measure
Interquartile range
500
The percentage of people that a person with a Z-score of 0 scored higher than on an anxiety measure.
50%
500
What will happen to the standard deviation of the sampling distribution of means if you increase sample size.
The standard deviation will decrease.
500
What you should do if you have non-linear, but monotonic data and originally were planning to run a Pearson's correlation.
Run a Spearman's Correlation instead.
500
A type of experimental design you should use if you plan to do a pre- and post-test on a between-subjects experiment to detect if there are any effects of pretesting itself.
A Solomon Four-Group Design
500
The solution to checking if you are concerned that your operationalization of your IV in your experiment might not actually be successfully manipulating the variable you intended, that doesn't involve actually changing your operationalization.
Adding a Manipulation Check
500
What you should do if a scale has a Cronbach's Alpha of .90, and the Alpha if item deleted value of Item 9 on the scale is .93.
Keep item 9.