Coordinate Grids/Points
Statistical vocabulary
Miscellaneous
Measures of Center
Statistiscal Graphs
100
TRUE or FALSE (explain why)
Reflecting a coordinate point across the x-axis changes the x coordinate.
What is false, because crossing the x-axis moves the point up or down which changes the y coordinate.
100
Name the point you find when using the process of finding the difference between the lowest and highest points in the data set
What is the range?
100
TRUE or FALSE: A good statistical questions is has a "yes" or "no" answer.
What is False?
100
Find the Median in the following data set: 9, 5, 6, 3, 6, 4, 7. 3
What is 5.5? (3, 3, 4, 5, 6, 6, 7, 9 ; 5+6 = 5.5)
100
How many data points are in this data set?
What are 25 data points?
200
What quadrant is point (-4, 4) located?
What is quadrant IV (four)?
200
Median
What is the middle number in a data set?
200
How far apart are these two units? (3, 7) and (3, -2)
What are 9 units apart? (|7| + |-2| = 9)
200
Find the range in the following data set: 8, 5, 10, 7, 2, 15, 8, 4, 4, 4, 12, 3.
What is 13? (15 - 2 = 13)
200
Name one difference between this histogram and a bar graph.

What are separate bars (not touching) and or single numbered intervals/bins?
300
Reflect the point below across the y-axix
What is (4, 5)
300
Another name for average.
What is the Mean?
300
Type of Statistical question: How many pairs of shoes do you own?
What is numerical?
300
Find the mean for the following data set: 8, 21, 9, 11, 2, 12
What is 10.5? (sum of all the numbers is 63/6=10.5)
300
At what data point is quartile 3 located? 
What is 22?
400
If the points (1, 1), (4, -3) and (0, -3) on a coordinate plane are the vertices of another triangle, what is the length of its height?
What is 4 units
400
The average distance of all the points in a data set from the mean of the data set.
What is Mean Absolute Deviation (MAD)?
400
How far apart are these two units? : (-3, 2) and
(-3, 6)
What are 4 units apart? (6-2=4)
400
Find the mode for the following data set: 3, 3, 5, 8, 10, 2 16, 22, 9, 2, 21, 34, 2, 8, 19, 15, 4,
What is 2? (the number 2 appears the MOST, three times in the data set)
400
What are the exteeme data points in this box and whisker plot.

What are 25 and 12?
500
Between which coordinates will we need to add to find the distance?

What are (-3, 1) and (2, 1)?
500
The calculation from subtracting the first quartile data point from the third quartile data point.
What is the Interquartile Range?
500
The two types of statistical questions.
What are numerical and categorical?
500
Find the MAD from the data set 5, 2, 6, 8, 4, when the mean is 5.
What is 1.6? (Abs Value distances : 0, 3, 1, 3, 1 = 8/5)
500
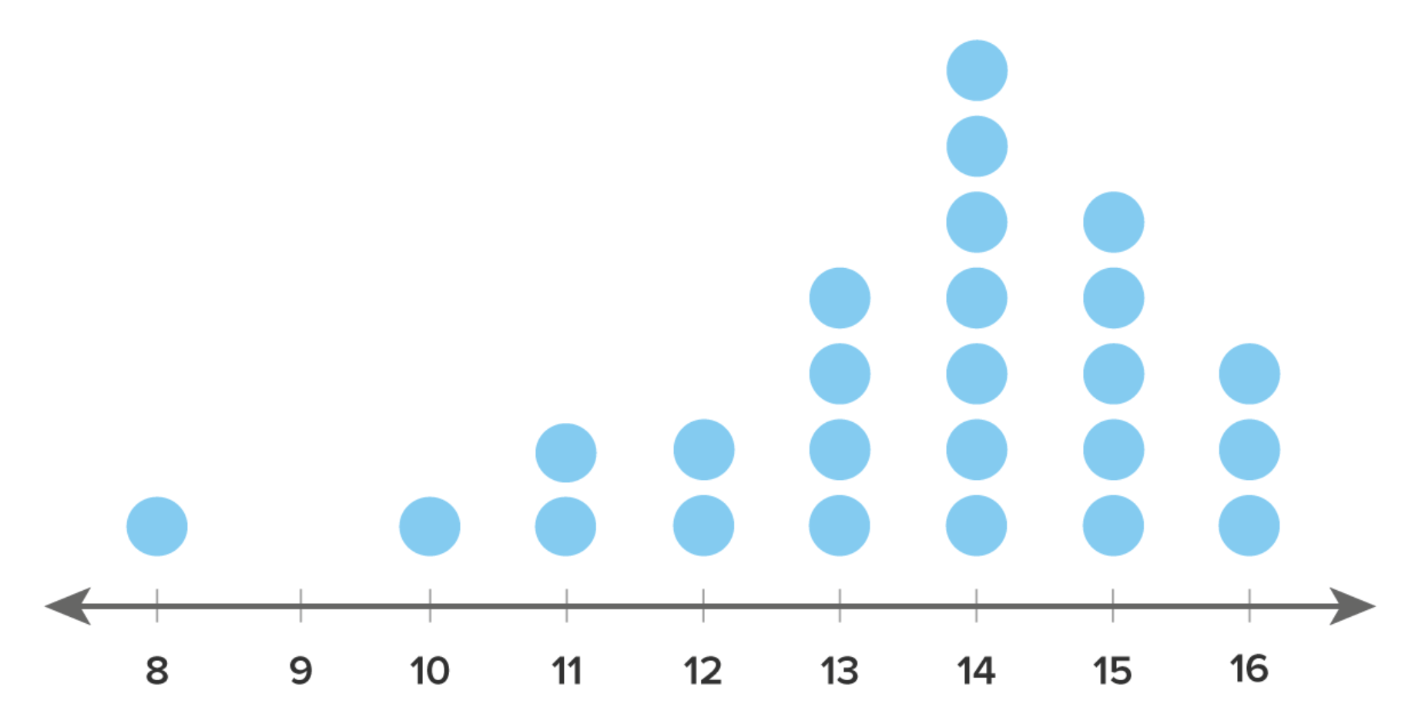
What is the skew of this dot plot?

What is skewed left?