Vocabulary
Equations and Inequalities
Statistical Measures
Data Displays
Miscellaneous
100
A Statistical Question is
A question for which you do not expect to get a single answer. Answers vary.
100
Write the word problem as an equation:
The sum of a number a and 17 is 21
a + 17 = 21
100
Find the Median of the data:
4, 3, -3, 5, -10
3
100
Find the MODE of the data.
Favorite Types of Music
Pop Pop Pop Rock
Pop Rock Pop Country
Country Pop Country Hip Hop
Pop Pop Country Rock
Rock Pop Hip Hop Rock
Pop
100
This is an example of what type of question...
How many hours do sixth-grade students sleep at night?
Statistical Question
200
A data value that is much greater or much less than the other values.
The Outlier
200
Write the word sentence as an equation.
14 is 7 times a number c
14 = 7c
200
The ages of ten employees at an insurance company are as follows:
43, 42, 51, 38, 52, 42, 21, 37, 47, 47
A. Find the mean
B. Find the Range of ages in the data set
A. 42
B. 31
200
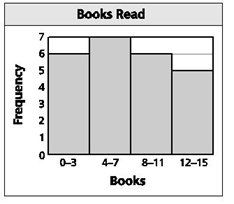
Record the data in a histogram chart:
Books Read
Books Frequency
0-3 6
4-7 7
8-11 6
12-15 5
200
What type of question is...
What is the height of the Empire State Building?
Non Statistical Question
300
A bar graph that shows the frequency of data values in intervals of the same size; the height of a bar represents the frequency of the values in the interval. There are no spaces between bars.
Histogram
300
Solve the equation:
14 + y = 20
y = 6
300
The data set shows the number of minutes sixth graders spend reading per night.
36, 12, 26, 20, 31, 30, 19, 34, 10, 24
A. Find the Mean.
B. Find the Median.
C. Find the Mode.
A. 24.2
B. 25
C. no mode
300
Write an inequality and a word sentence that represents the graph.
*------------------------------>
 -2 -1 0 1 2 3 4 5 6 7
k >= -1
A number k is at least -1
300
Solve the equation:
x - 7 = 12
x = 19
400
Tell the difference between and how you find the mean, median, and the mode of a data set.
Mean: average value in a data set:
Add all values and divide by the number of values in the set.
Median: the middle value in the data set.
Put data values in order from least to greatest, the find the middle value.
Mode: the value that occurs most in the value set.
400
You can spend at the most $10 at the mall. You want to buy a book that costs $6.75 and a cold drink. Write and solve the inequality to represent the amount of money you can spend on your cold drink.
d + $6.75 <= $10.00
d <= $3.25
400
Find the mean, median, mode, range and outlier of the data set.
48, 41, 49, 42, 42, 38, 40, 60
Mean: 45
Median: 42
Mode: 42
Outlier: 60
400
Solve the inequality and graph the solution.
80 > 20b
4 > b or b < 4
<--------------------------o
 -2 -1 0 1 2 3 4 5 6 7
400
What are the three ways to find the center of measure of a data set
The mean, median and mode
500
What is a Dot Plot: and describe the Peak, Cluster and Gap of the data value set.
A Dot Plot is a statistical chart used to graph data values using a number line with dots to represent the data values.
Peak: is the highest point with the greatest number of values on a dot plot
Cluster: is the space on a dot plot that has the most amount of data.
Gap: is the space on a dot plot with no data values.
500
You must be at least 48 inches tall to go on Space Mountain at Six Flags. You must be at the most 48 inches tall to go on the Tea Cups at the park.
A. What is the inequality that represents the height you must be for each of the rides.
B. You are allowed to go on both rides. What is your height?
A. Space Mountain: h >= 48
Tea Cups: h <= 48
B. 48 inches
500
Each of five children picks out a birthday present for their mother. They share the total cost of the gifts equally.
$9.94, $10.25, $9.80, $9.95, $24.95
A. Find the mean, median, and mode
B. Which measure best represents the typical price of a gift?
C. Which measure best represents each child's share of the cost?
A. mean $12.98
median $9.95
mode $9.95
B. the median or mode
C. the mean
500
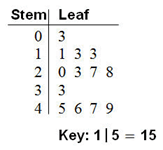
Use the Stem and Leaf plot to find:
A. How many data values are in the set?
B. What is the median?
C. What is the range?
D. What is the mode?
A. number of data values: 13
B. median: 27
C. range: 46
D. mode: 13
500
A wheelbarrow can carry up to 300 pounds of weight. A bag of soil weighs 20 pounds. Write and solve an inequality to represent the number of bags of soil the wheelbarrow can carry.
20b <= 300
b <= 15
The wheelbarrow can hold at the most 15 bags of soil