Eukaryotic Organelles
Eukaryotic Organelles Continued
Eukaryotic Cells Vs Prokaryotic Cells
Graphs
Graphs Continued
100
I am the jelly-like fluid inside the cell. I provide an area of movement for all the dissolved molecules that keep the cell working.
Cytosol
100
I am only found in plant cells. I am the outermost part of the plant cell. I provide supports and protection and give plants their shape since, they don't have bones.
Cell Wall
100
A _______ is the most basic unit of living organisms.
Cell
100
Which animal has a life span closest to that of sheep?
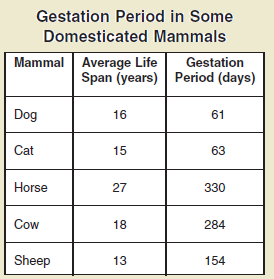
Cat
100
The line graph shows five years of data about a dog. What information does the graph show?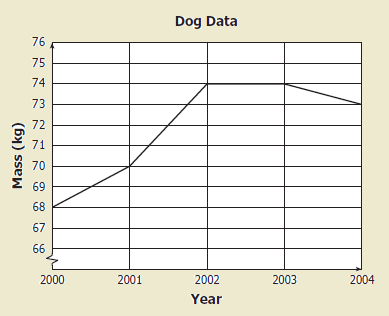
A.) How the mass of the dog changed
B.) How much food the dog consumed
C.) What kinds of food the dog consumed
D.) When the dog was measured each month
A.) How the mass of the dog changed
200
I am the "brain" of the cell, and I control all the activities of the cell.
Nucleus
200
I am a thin protective layer around the cell, but I am not one solid piece. I have tiny openings that allow materials to pass in and out of the cell.
Cell Membrane
200
What two groups are Eukaryotic cells divided into?
Plant cells and Animal Cells
200
Crickets chirp to attract other crickets. The temperatures and rates of their chirping are graphed above. Which statement below is most likely true for the data represented in the graph?
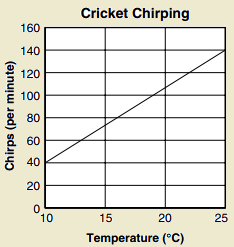
A.) The cooler the temperature, the louder the crickets chirp.
B.) The crickets cannot chirp at temperatures lower than 10 degrees C.
C.) The warmer the temperature, the more often crickets chirp.
D.) The temperature and the chirping of crickets are not related.
C.) The warmer the temperature, the more often crickets chirp.
200
(2004) This chart represents the type and number of items collected in a beach cleanup. Based on the above chart, what percentage of the total items collected from the beaches was plastic?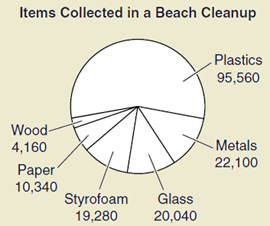
A.) 46%
B.) 49%
C.) 56%
D.) 70%
C.) 56%
300
I am a food producer for plant cells. I absorb light energy from the sun and use it to convert carbon dioxide and water to sugar and oxygen. I am not found in animal cells.
Chloroplast
300
When a cell needs energy, I take in nutrients, break them down, and supply energy to the cell. I also convert stored energy in the cell to food.
Mitochondria
300
A bacteria is an example of which cell type?
Prokaryotic Cells
300
Scientists have spent many years studying the peppered moth, which is a species that has adapted its color from light to dark in reaction to environmental pollution. Which of the following line graphs represents the data from the table?
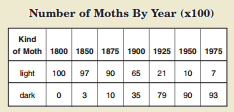
A.) 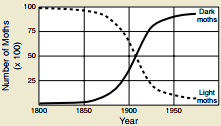
B.) 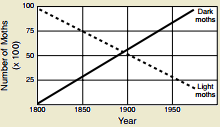
C.) 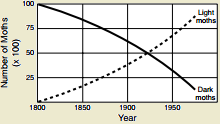
D.) 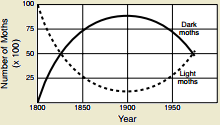
A.)
300
According to this chart, which planet will most likely have the highest temperatures?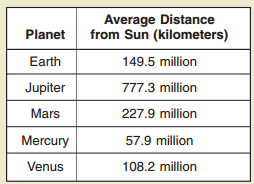
A.) Earth
B.) Mars
C.) Mercury
D.) Venus
C.) Mercury
400
I act like a digestive system in an animal cell. I contain enzymes that break down wastes and other material.
Lysosome
400
We build proteins in the cell. We can be found in several places in the cell, including in the cytosol and on the endoplasmic reticulum.
Ribosomes
400
A cheek cell, onion cell, and a celery cell are all examples of which cell type?
Eukaryotic Cell
400
According to this graph, which of these is most important in developing the biomass of these plants?
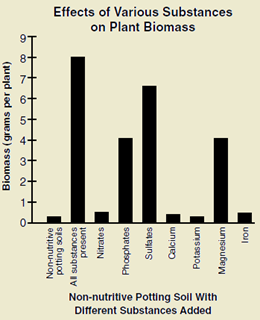
A.) Nitrates
B.) Sulfates
C.) Magnesium
D.) Iron
B.) Sulfates
400
The chart shows the results of an experiment to test the effects of different plant lights on plant seedling growth. Which group of plants showed the greatest gain in height?
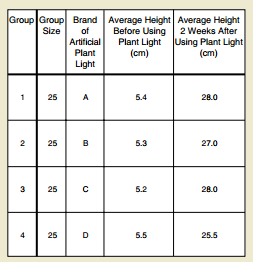
A.) Group 1
B.) Group 2
C.) Group 3
D.) Group 4
C.) Group 3
500
I am the cells transport system. There are two types of me, rough and smooth. The rough type has ribosomes attached that make proteins.
Endoplasmic Reticulum
500
I gather molecules and make them more complex. I store these molecules or send them into the cytosol or out of the cell. I process proteins produced by the endoplasmic reticulum and ribosomes.
Golgi Apparatus
500
Which cell type does not have a nucleus or any organelles?
Prokaryotic cells
500
The line graph shows the heights of plants grown in fertilized and unfertilized soil. Based on this information, what will most likely occur on day six?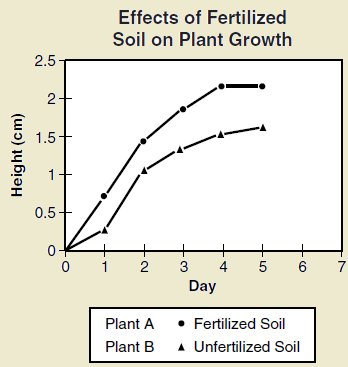
A.) Neither plant should increase by 1 cm in height.
B.) Plant A should increase about 1 cm in height.
C.) Plant B should increase about 1 cm in height.
D.) Plant A should increase about 2 cm in height.
A.) Neither plant should increase by 1 cm in height.
500
According to the graph, which air pollutant decreased the most from 1970 to 1991?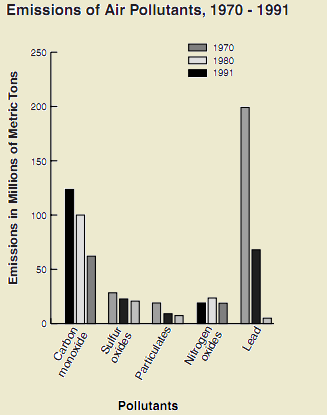
A.) Carbon monoxide
B.) Sulfur oxides
C.) Particulates
D.) Lead
D.) Lead