Ratio Tables and Graphs 1
Ratio Tables & Graphs 2
Ratio Tables and Graphs 3
100
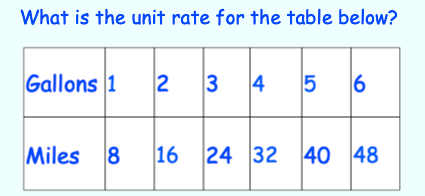
8 miles per gallon
100
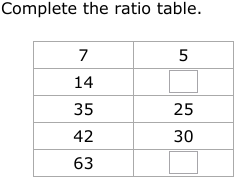
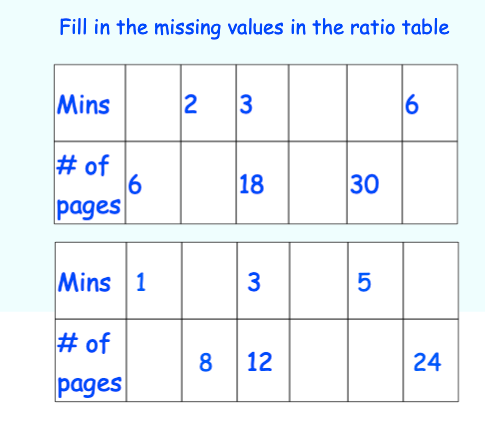
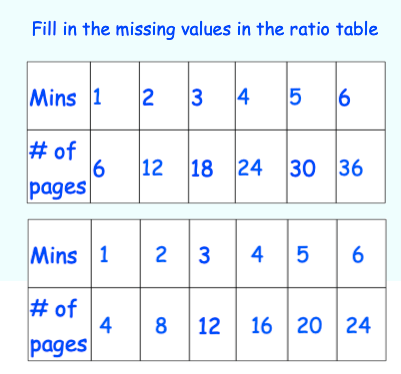
Complete the table.
14
100
Find the value of x.

X = 3 kids
200
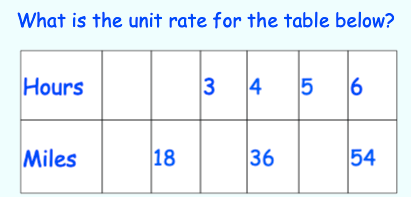
9 miles per hour
200
10, 45
200
Find the value of x.
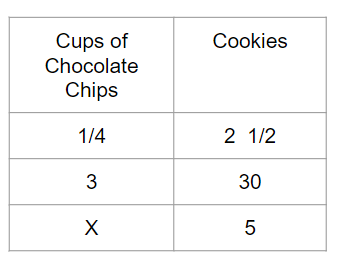
X = .5 cups of chocolate chips
300
What is the unit price?
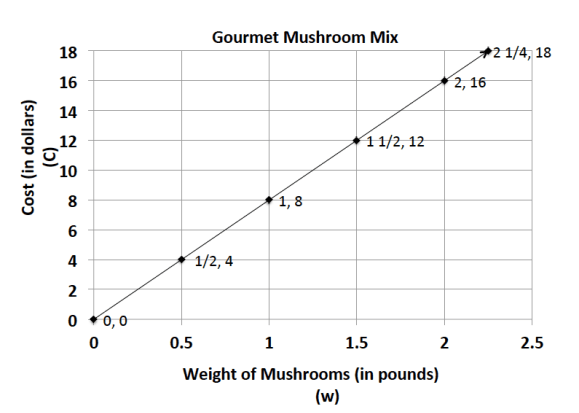
$8 per pound
300
Based on the graph above, predict how much 7 t-shirts would cost.
$63
300
Find the value of K.
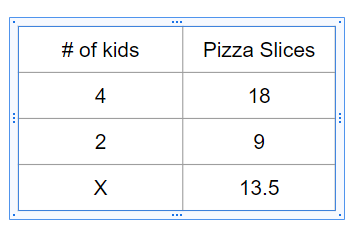
K = 4.5 slices per kid
400
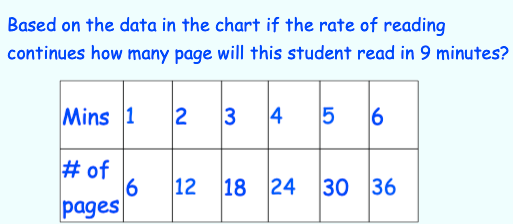
54 pages
400
Bob (sample answer: because his graph is increasing at a faster rate)
400
Which ordered pair matches the graph?
A. (4,24) B. (6,32) C. (8,16) D. (0,8)
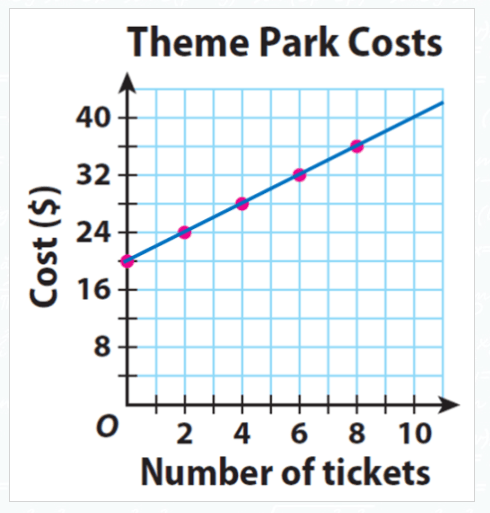
B
500
500
$60
500
What is the unit rate?
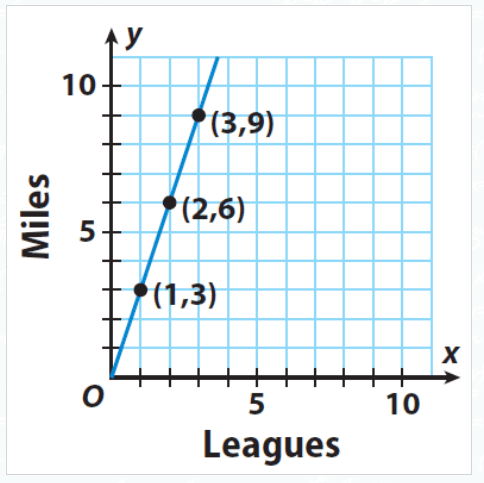
3 leagues per mile