r and R2
Quadratic Regression
Linear Regression
Exponential Regression
Mixed Bag
1
Describe r=-0.483
Negative Average
1
Name 3 pieces of information Desmos gives us by typing in the quadratic regression formula.
The values of a, b, and c.
1
Name 2 pieces of information Desmos gives us by typing in the linear regression formula.
The slope, m, and the y-intercept, b.
1
Name 2 pieces of information Desmos gives us by typing in the exponential regression formula.
The values of a, and the base, b.
1
What should determine how confident I am in my predictions?
The value of r (linear) or R2 (quadratic/exponential)
2
Describe R^2=0.2382
Weak (Line of Best Fit/Regression Line does not fit the data points very well).
2
What is the quadratic regression formula?
y1 ~ ax12 +bx1 + c
2
What is the linear regression formula?
y1 ~ mx1 +b
2
What is the exponential regression formula?
y1 ~ a * bx1
2
True/False
My data table lists x2 and y2. I type y1~mx1+b. Desmos will give me an accurate value for m and b.
FALSE!
The regression formula MUST match the labels (x1 and y1) in the data table.
3
True/False
R^2 is always positive
True
3
Given the following values,
a = -3.4
b = 0.68
c = 17
what is the predictive value of y when x = -5
y = -71.4
3
Given the following values,
m = -0.569
b = 17.3
predict the value of y when x = 12
y = 10.472
3
Given the following values,
a = 491
b = 0.32
predict the value of y when x = 3.9
y = 5.769875
3
Which regression formula would you use for this scatterplot?
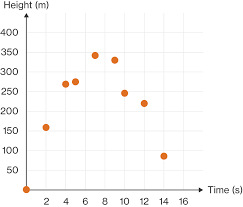
Quadratic
4
Correlation Coefficient, r , describes the strength between the ______________ and ____________ variables.
Independent and Dependent
4
In our class data, go to "Concentration of Medication of Blood Over Time". What is the quadratic regression EQUATION we should use to make predictions?
y = -56.2143x2 + 139.313x +9.35
4
In our class data, go to "Test Results". What is the linear regression EQUATION we should use to make predictions?
y = -0.735208x + 47.3562
4
In our class data, go to "Bacteria Growth". What is the exponential regression EQUATION we should use to make predictions?
y = 26.512 * 1.49719x
4
Which regression formula would you use for this scatterplot? 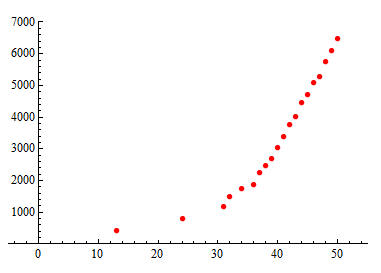
Exponential
5
Coefficient of Determinations, R^2 , describes the relationship between the ____________________ and the ________________.
Line of Best Fit or Regression Line
and
Data Points
5
In our class data, go to "Concentration of Medication of Blood Over Time". Why will predicting concentration of medicine after 3 hours give us a false answer?
The concentration of medicine = -78.64mg/L. We cannot have negative medicine in our blood.
5
In our class data, go to "Test Results". Why will predicting an x value of "65 minutes" give us a false result?
We would have a y value of -0.43232. In other words, we would have -0.43232 questions wrong.
That doesn't make sense.
5
In our class data, go to "Boomtown". What year did Boomtown have a population of 1000?
1970.
5
In our class data, go to "Line of Best Fit". Using the GPA vs. TV Hours data, which regression EQUATION should we use to make predictions? How do we know?
Linear.
Linear, r = -0.9304
Quadratic, R2= 0.8903
Exponential, R2= 0.7918