Sort of like Vocab
How good is that Fit?
What does it mean?
Your Pattern did What?
Mixed Review
100
What does the r value tell us (3 things!)?
The strength and direction of a linear relationship
100
Which would have the larger r value?
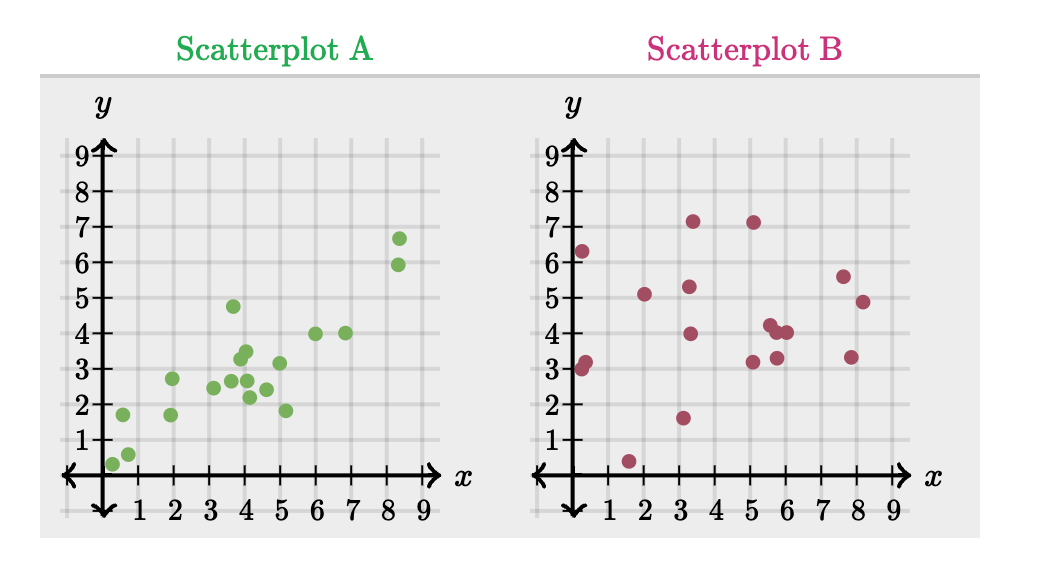
Scatterplot A
100
Ireland wants to see the relationship between the number of number of movies actors have been in (x) and their net worth in millions (y) She finds that the equation is y = .32x + 0.05 and the R2 =.18.
What does the R2 mean
That 18% of variation in net worth can be explained by the change number of movies you are in.
100
As x increases, y increases
what is a positive correlation?
100
When given two choices (like A and B), what must you do to get full credit?
Explain both and choose one of them!
200
Which of the following r values represents the best correlation?
a) .89
b) .67
c) -.96
d) .95
c
200
Describe the realtive strength and the direction of this correlation
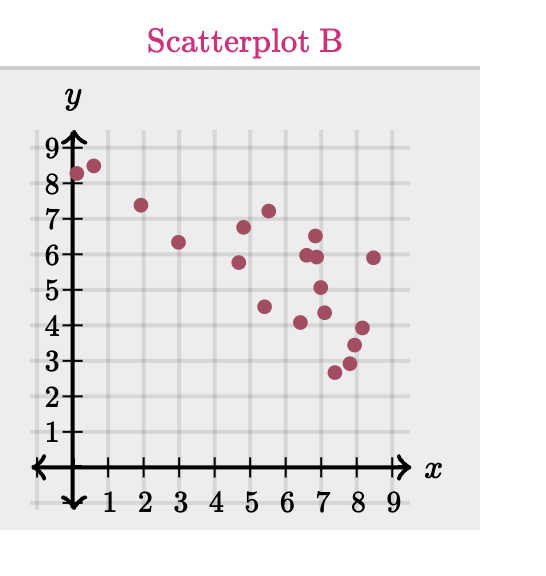
moderate to strong negative
200
Ireland wants to see the relationship between the number of number of movies actors have been in (x) and their net worth in millions (y) She finds that the equation is y = .32x + 0.05 and the R2 =.18.
What does the slope mean (be careful - this is a regression)
That overall (in general, on average) your net worth increases .32 million for every movie you are in.
200
Jason finds the heights of all his friends in middle school and then plots them according to their respective ages. He performs a regression and finds the LSRL. He then uses his LSRL to predict what their height will be when they are 50 years old. Did jason pay attention in stats class? Explain.
He must have been sleeping in class! This is an EXTRAPOLATION since his prediction for 50 years is outside the interval that he looked at (11-13 years) and the LSRL may not provide the best estimate. Wake up Jason!
200
This measure of center is less susceptible to outliers than the mean.
What is the median
300
The percent of variation in the response variable that is explained by the variation in the explanatory variable
What is the r2 value?
300
Judging by the residual plot below, was the correct graph type fit to the data?
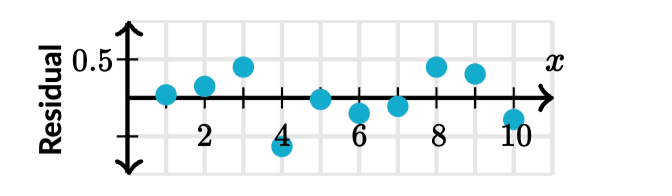
Yes
300
Ireland wants to see the relationship between the number of number of movies actors have been in (x) and their net worth in millions (y) She finds that the equation is y = .32x + 0.05 and the R2 =.18.
What would you predict for someone who has been in 6 movies? Do not round
1.97 million.
300
You make a scatterplot of height versus weight for 2,000 kids from birth to 18. What sort of pattern would you expect to see? (describe the relative strength and the direction only)
Strong Positive
300
What does a z-score of -1.7 mean?
The data point is 1.7 standard deviations below the mean.
400
This is a way of estimating the 'average' error in a prediction from a regression line
standard error of the residuals or s
400
True of false. Based on the residual plot below, The prediction errors generally decrease as the x value decreases.
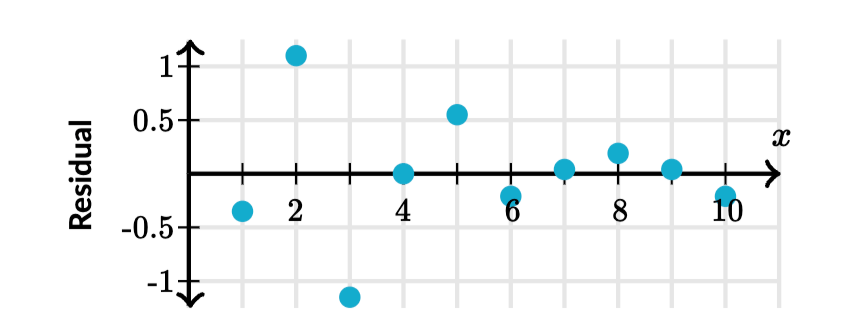
False.
400
Ireland wants to see the relationship between the number of number of movies actors have been in (x) and their net worth in millions (y) She finds that the equation is y = .32x + 0.05 and the R2 =.18.
What does the y-intercept mean?
That in general those starting in the career (0 movies so far) have a net worth of .05 million (or 50,000)
400
You make a scatterplot that shows the number of concerts members of the senior class (at a large HS) have bought versus the money in their checking account. What sort of pattern do you expect to see?
Include relative strength and direction
Weak to moderate negative
400
This measures how spread out a data set is
What is standard deviation?
500
Plotting these can help us to determine if we fit the correct type of graph (linear, quadratic, exponential etc.) to our data.
What are residuals?
500
The point in the bottom left is considered what type?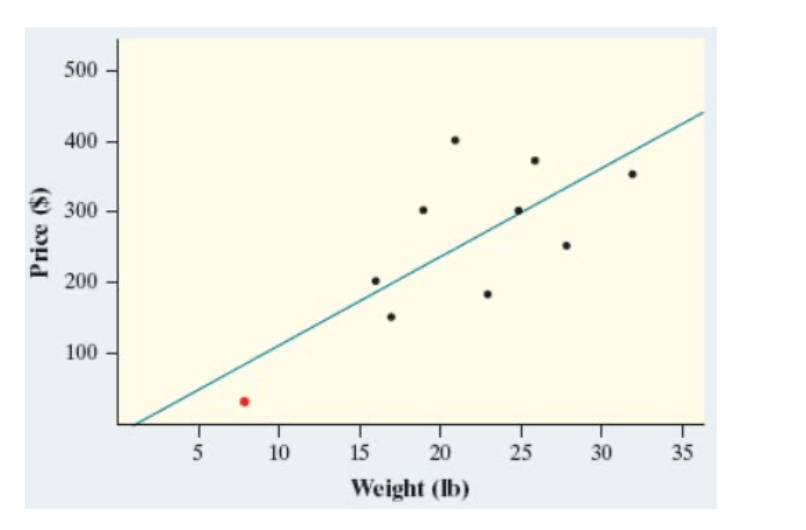
High Leverage
500
Andrea finds r=0.97 showing there is a very strong, positive linear association between ice cream sales and crime rates. Does this mean that we can conclude that ice cream sales are responsible for variation in crime rates? EXPLAIN
NO! Correlation does not imply causation!!!!
500
If the residual plot looks like a U, what does this tell you?
That the linear model is not a good fit and that something non-linear is better.
500
Women's shoe sizes fit a normal curve. The mean US women's shoe size is 8 with a standard deviation of 1.5
What percentage of woman have shoes sizes between 5 and 9.5?
81.5%