Calculate the average speed of a car that travels 120 km in 2 hours.
60 km/h
What’s the main difference between speed and velocity?
Speed is a scalar (magnitude only), while velocity is a vector (magnitude and direction).
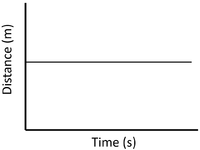
What does a horizontal line on a distance-time graph indicate?

The object is at rest (no movement).
A train travels north at 90 km/h. Is this an example of speed or velocity?
Velocity (because it includes direction).
What unit is commonly used to measure speed in science?
Meters per second (m/s).
What is the formula for calculating average speed?
Average speed = Total distance / Total time.
True or False: Velocity changes if direction changes, even if speed remains constant.
True
What does a steeper slope on a distance-time graph indicate about an object’s speed?
The object is moving faster.
True or False: Two objects traveling at the same speed but in opposite directions have the same velocity.
False (velocity includes direction).
What is displacement?
The shortest distance and direction from the starting point to the endpoint.
A runner travels 5 km in 30 minutes. What is their average speed in km/h?
10 km/h.
Give an example of velocity.
Example: A car moving at 50 km/h north.
If a line on a distance-time graph curves upwards, what does this indicate?

The object is accelerating.
Describe a real-world example where knowing both speed and velocity would be important.
Answers may vary; example: a pilot needs both speed and direction for safe navigation.
An object moves with a velocity of 20 m/s for 4 seconds. How far does it travel?
80 meters
If a plane flies 800 km in 2 hours, stops for 30 minutes, then flies another 600 km in 1.5 hours, what is its average speed for the entire trip?
350 km/hr
A person walks 3 km east and then 4 km south. What is their displacement?

5 km (using the Pythagorean theorem).
Describe what a distance-time graph looks like when an object moves at a constant speed.
A straight, diagonal line with a consistent slope.
A cyclist travels east for 2 hours at 10 km/h, then south for 1 hour at 10 km/h. What is the cyclist’s total distance?

30 km.
A distance-time graph shows a line curving downwards. What does this indicate?

The object is decelerating (slowing down).
Describe a scenario where the average speed and instantaneous speed are different.
Example: A car trip with stops and varied speeds (e.g., driving at different speeds on a highway vs. in traffic).
If a car travels 10 km west and then 10 km east, what is the total displacement and why?
0 km, because displacement measures the change in position from the starting point.
If a runner travels 100 meters in 10 seconds, what would the slope of the distance-time graph represent?
The runner’s speed, 10 m/s.
A ship sails 100 km north, then 100 km east. What is the total distance traveled and the displacement?
Total distance = 200 km; displacement ≈ 141.42 km northeast.
If a car’s speed changes while its direction stays the same, is its velocity constant?
No, because velocity includes both speed and direction; a change in speed changes velocity.